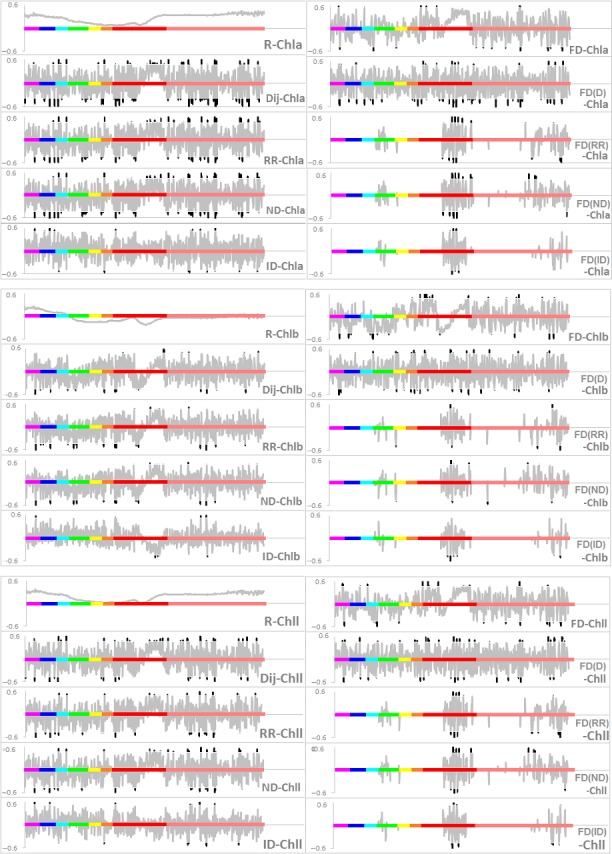
Figure 3.

The correlation coefficient curves of combinations of R i, R j with leaf Chla, Chlb and Chll content, respectively. The x‐axes indicate the wavelength ranges from violet, blue, cyan, green, yellow, orange, red to near‐infrared light (350–1000 nm). The y‐axes indicate the correlation coefficient. The curves in light dark indicate nonsignificant coefficients, in deep dark indicate significant coefficients with p < 0.05
