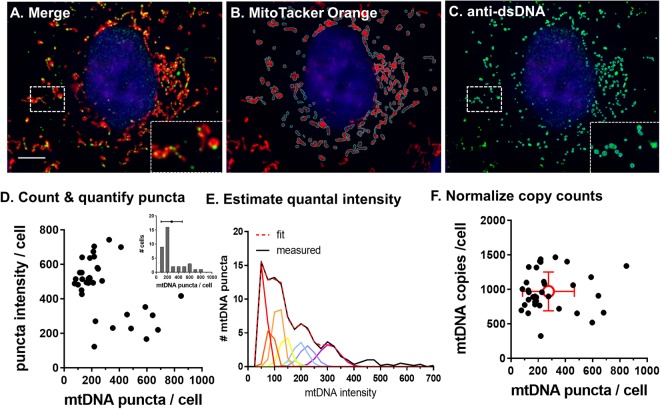
Figure 4.
mtDNA copy number estimated by counting dsDNA puncta in mitochondrial corroborates absolute CN quantification by ddPCR. A-C. A7r5 cells labelled with (B) MitoTracker Orange, fixed and stained with (C) anti-double-stranded DNA antibody to detect mtDNA were imaged with a 100 × 1.45NA objective. dsDNA puncta were analyzed with ImageJ using a custom written multiple-thresholds segmentation algorithm with cell ROIs drawn by hand to exclude the nucleus. (D) Puncta/cell as a function of mean puncta intensity per cell. Inset: Histogram of mtDNA puncta / cell showing mean and SE (dot and horizontal bars). (E) The intensity distribution of mtDNA puncta was fitted with a 10-Gaussian model to estimate single genome intensity. mtDNA copy number per cell is the sum of puncta intensities divided by the single genome intensity. (F) mCN calculated from the estimate of single nucleoid intensity reduced variance in the calculation of mtDNA copy number compared to counting of mtDNA puncta.

