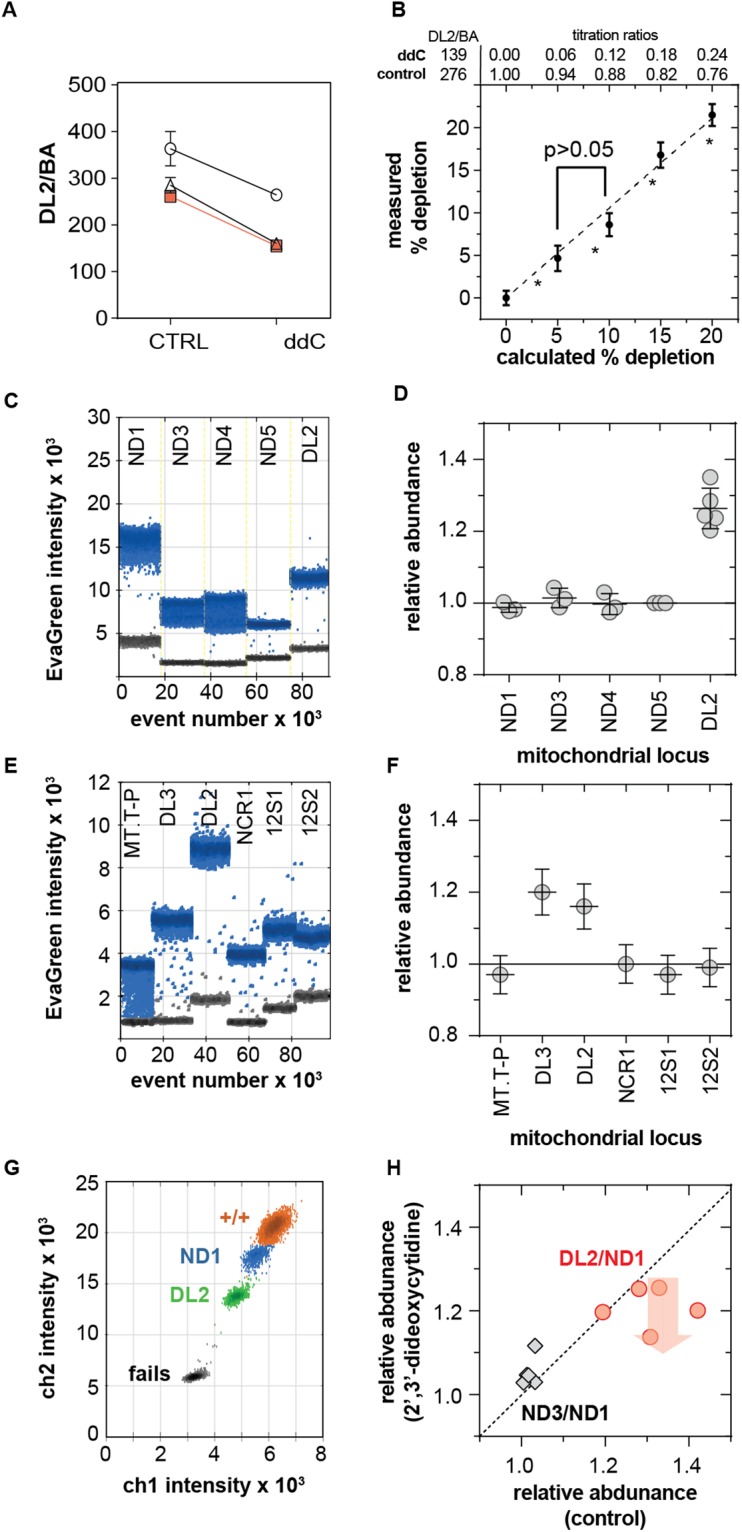
Figure 5.

Assay sensitivity and anomalous DL copy number. (A) DL2:BA ratio from multiplex assay of gDNA from A7r5 cells grown in normal culture media without (CTRL) or with 2,3-dideoxycitidine (ddC, 30 µM) for 2–14 days. Error bars are standard error. (B) Assay sensitivity was assessed by titrating gDNA from control and ddC-treated cells to create known levels of mtDNA depletion. *All pair-wise comparisons are significantly different other than for the 5% and 10% groups. C. Singleplex droplet distributions for ND and DL2 primers amplifying A7r5 gDNA. (D) Copy numbers from C normalized to ND5 for each experiment. (E) Representative singleplex droplet distributions for DL2 and flanking primers (see Fig. 1) using A7r5 gDNA. (F) Copy numbers from E normalized to NCR1. Error bars are 95% confidence interval of Poisson-corrected concentrations (G) Typical droplet intensity distribution for the ND1-DL2 assay. (H) Sister cultures of A7r5 cells treated with ddC (as in A) or vehicle (control), and analyzed for DL2:ND1 and ND3:ND1 ratios. Dotted line indicates no difference. Data points below line show depletion by ddC.
