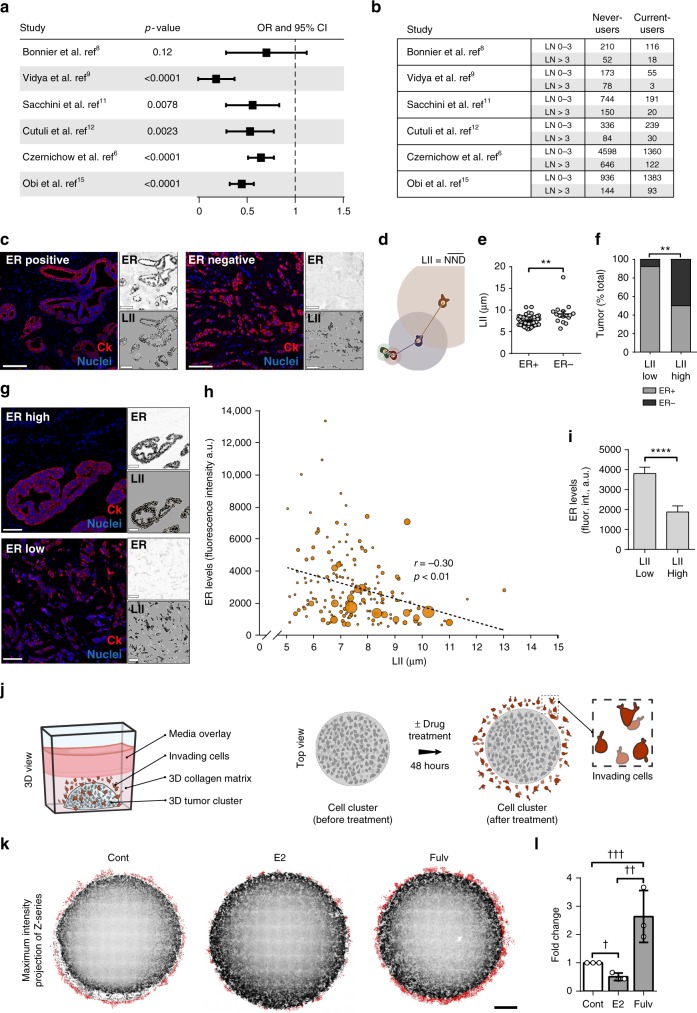
Fig. 1.
ER expression is associated with low dissemination of breast cancer cells. a Meta-analysis of LN dissemination. Forest plot showing odds ratio, with 95% confidence interval (OR, 95% CI) of LN >3 in current-users compared with never-users of HRT. b Number of never-users and current-users with either LN ≤3 or LN >3 in the studies analyzed in a. c Representative images of ER+ (left panel) and ER− (right panel) tumors from TMA#1 (CDP-BCP-TMA), labeled for cytokeratin (red) and nuclei (blue). Scale bar is 100 µm. Top-right inset shows ER labeling and bottom-right inset shows binary masks of cytokeratin stain (black) and nuclei (orange). d Illustration of local invasion index (LII) measurement. Connecting lines represent the nearest neighbor distance (NND) of illustrated cells (color of each line matches color of corresponding cell). LII is calculated as mean NND. e Quantification of LII in TMA#1 (mean ± s.e.m); **p = 0.001 (unpaired t test). f Percentage of ER+ (gray) and ER− (black) tumors in low (≤7 µm) and high (≥9 µm) LII bins in TMA#1; **p = 0.002 (unpaired t test). g Representative images of luminal B breast tumors from TMA#2 (Cedars-Sinai LumB TMA) with high (top panel) or low (bottom panel) ER expression. Top-right inset shows ER labeling and bottom-right inset shows binary masks of cytokeratin stain (black) and nuclei (orange). Scale bar is 100 µm. h Scatter plot of LII and ER levels in TMA#2. For each data point, bubble area is proportional to the number of positive lymph nodes in the corresponding patient; r is Pearson’s correlation coefficient; correlation is significant at p < 0.01. a.u. = aribitrary units. i ER levels in tumors with low (≤7 µm) and high (≥9 µm) LII in TMA#2; mean ± s.e.m. ****p < 0.0001 (Welch’s t test). j Illustration of 3D culture system for quantification of invasion in vitro. Cells embedded in central area invade into surrounding collagen matrix. Zoomed-in illustration of the boxed area shows invading cells in red. k Maximum intensity projections of confocal z-series of ER+ breast cancer MCF7 cells treated with drug vehicle, estradiol (E2), or fulvestrant (fulv). Binary mask (red) highlights invaded cells. Scale bar is 500 µm. l Quantification of invasion. Data are from three independent experiments; mean ± s.d. †p = 0.003, ††p = 0.01, †††p = 0.03 (unpaired t test)

