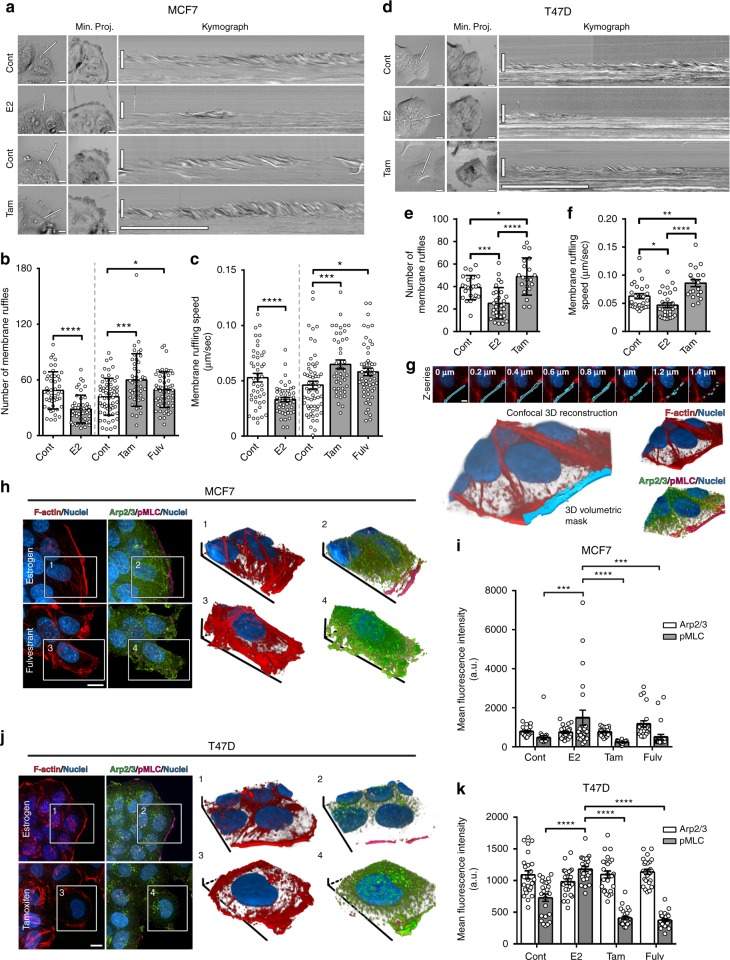
Fig. 2.
ER-mediated actin cytoskeletal remodeling induces suppressive cortical actin bundles (SCABs). a Leading edge kymography in representative time-lapse movies (Supplementary Movie 1) of control and E2-treated MCF7 cells (cultured under hormone starvation conditions), and control and ER-inhibited cells (cultured in regular media). Left panels indicate position at which kymographs were registered (line), and middle panels show minimum intensity projections from entire time series (Min. Proj.); scale bar is 10 µm. Right panels show corresponding kymographs; vertical scale bar is 10 µm; horizontal scale bar is 5 min. b Membrane ruffle quantification; mean ± s.d; *p = 0.03, ***p = 0.0005, ****p < 0.0001 (Welch’s t test). c Ruffling speed quantification; mean ± s.e.m; *p = 0.01, ***p = 0.0007, ****p < 0.0001 (Welch’s t test). Data from three independent experiments (n ≥ 45 cells per group). d Leading edge kymography in representative time-lapse movies (Supplementary Movie 2) of T47D cells. e Membrane ruffle quantification; mean ± s.d; *p = 0.03, ***p = 0.0002, ****p < 0.0001 (Welch’s t test). f Ruffling speed quantification; mean ± s.e.m; *p = 0.01, **p = 0.004, ****p < 0.0001 (Welch’s t test). Data from two independent experiments (n ≥ 30 cells per group). g Volumetric analysis of leading edge actin. Illustrative confocal z-series and corresponding 3D binary mask, demarcated as the area within 3 µm of cell edge and used to quantify leading edge fluorescence intensity. h Maximum intensity projections of z-series of E2-treated or fulv-treated MCF7 cells (Supplementary Movie 4), and 3D reconstructions of boxed areas; F-actin (red), Arp2/3 (green), and pMLC (magenta). Scale bar is 10 µm. i Quantification of leading edge Arp2/3 and pMLC in MCF7 cells. Data from three independent experiments (n = 21 cells per group; mean ± s.e.m). By two-way ANOVA, interaction analysis shows significant differences at p < 0.0001 (df = 3); pMLC values are significantly different in E2-treated group compared to other groups (p < 0.001). Arp2/3 values are not significantly different between groups. j Maximum intensity projections of z-series of E2-treated or tam-treated T47D cells and 3D reconstructions of boxed areas. F-actin is red, Arp2/3 in green, and pMLC in magenta. Scale bar is 10 µm. k Quantification of leading edge Arp2/3 and pMLC in T47D cells. Data from three independent experiments (n = 21 cells per group; mean ± s.e.m). By two-way ANOVA, interaction analysis shows significant differences at p < 0.0001 (df = 3); pMLC values are significantly different in E2-treated group compared to other groups (p < 0.001). Arp2/3 values are not significantly different between groups

