Fig. 3.
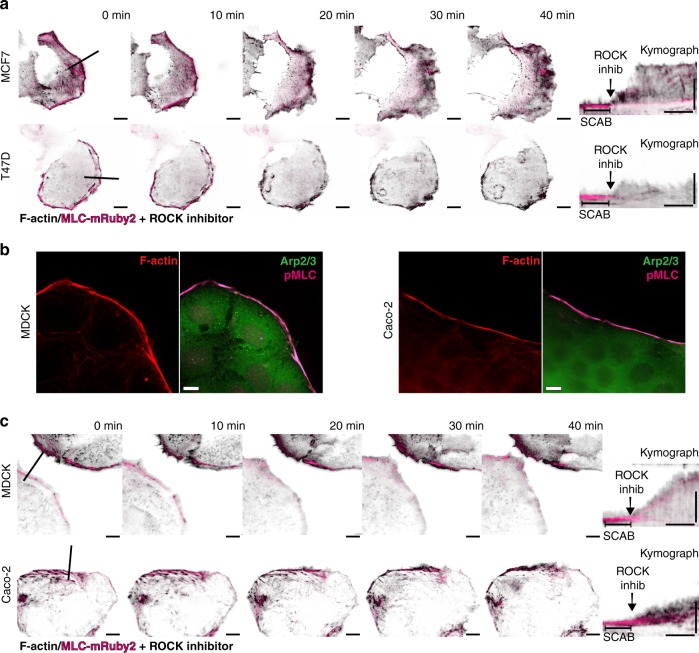
SCABs suppress leading edge motility in a myosin contractility-dependent manner. a Leading edge kymography in MCF7 cells (top row) and T47D cells (bottom row) expressing iRFP-Lifeact (black) and MLC-mRuby2 (magenta) before and after dissolving SCABs using 25 µM ROCK inhibitor. Left panels are images from TIRF microscopy time-lapse series before and after the addition of ROCK inhibitor (Supplementary Movie 5). Scale bar is 10 µm. Line shows the leading edge position at which kymographs were registered. Right panel shows MLC kymograph (denoting SCABs) superimposed over Lifeact kymograph (demarcating the leading edge). Vertical scale bar is 10 µm and horizontal scale bar is 10 min. b Immunofluorescence of SCAB in MDCK epithelial cells and Caco-2 human intestinal epithelial cells. Representative images for F-actin, pMLC, and Arp2/3. Scale bar is 10 µm. c Leading edge kymography in MDCK cells (top row) and Caco-2 (bottom row) cells expressing iRFP-Lifeact (black) and MLC-mRuby2 (magenta) before and after dissolving SCABs using 25 µM ROCK inhibitor. Scale bar is 10 µm. Line shows the leading edge location at which the kymograph was registered. Right panel shows MLC kymograph (denoting SCABs) superimposed over Lifeact kymograph (demarcating the leading edge). Vertical scale bar is 10 µm and horizontal scale bar is 10 min

