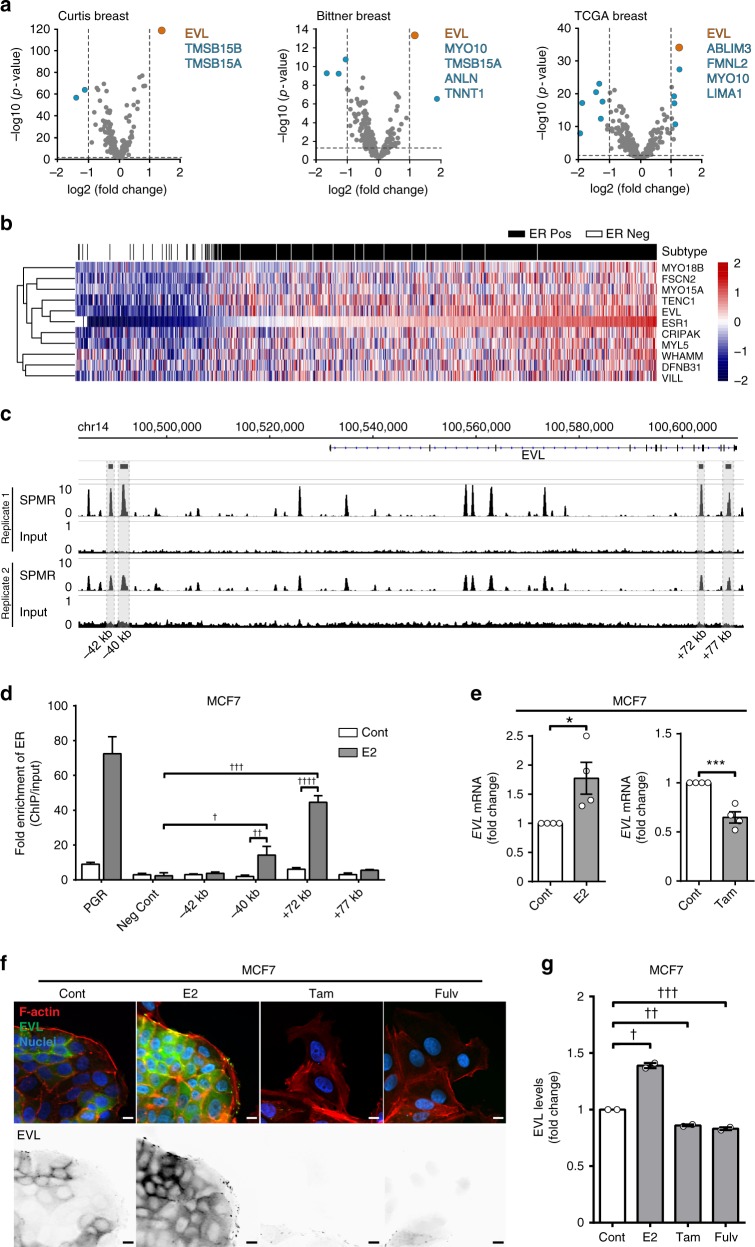
Fig. 4.
EVL is a transcriptional target of ER. a Differential gene expression analysis of actin cytoskeletal regulators in ER+ vs. ER− breast tumors. Volcano plot of significance (−log10 of p value) vs. log2 fold change. Horizontal dashed line represents threshold for significance at p < 0.05. Vertical dashed lines represent threshold for positive or negative twofold change in gene expression. Insets are lists of genes that passed both thresholds in descending order of significance (lists were limited to five genes; full data analyses are presented in Supplementary Data 3). b Unsupervised clustering analysis of TCGA RNA-seq dataset. Heatmap, generated by row scaling, showing expression of genes in the ESR1 cluster. Tumor samples were classified into ER+ (black) and ER− (white) based on ER status (paired t test used to determine significance). c Analysis of ER binding by chromatin immunoprecipitation (ChIP). Genomic region surrounding EVLshowing ER-ChIP sequencing profile as SPMR (signal per million reads) trace of two independent ER-ChIP sequencing samples, generated by MACS2.0 and visualized by IGV (Integrative Genomics Viewer). Corresponding input profiles are shown at ×10 scale to clearly show the input DNA openness bias. d Fold enrichment of ER binding at four peaks found by ChIP-seq, in addition to positive (PGR) and negative controls. Fold enrichment is calculated as [DNA]-normalized ChIP/Input of 2ΔΔCt. Values are means of data from four replicates; mean ± s.e.m.; p values were generated by paired t test comparing E2 treated to vehicle treated and E2 treated to negative control; †p = 0.009, ††p = 0.007, †††p = 0.001, ††††p = 0.001. e Analysis of the Regulation of EVL expression by ER. qPCR of EVL mRNA in MCF7 cells treated with corresponding drugs for 24 h, normalized to GAPDH. Fold change shown between treatment groups. Values are means of data from four independent experiments; mean ± s.e.m.; *p = 0.03, ***p = 0.0008 (unpaired t test). f Immunolabeling of MCF7 cells after corresponding drug treatment for 72 h. Bottom row shows EVL labeling. Scale bar is 10 µm. g Quantification of EVL levels in MCF7 cells after treatment with corresponding drugs for 72 h. Values are means of data pooled from two independent experiments; mean ± s.e.m. †p = 0.03, ††p = 0.03, †††p = 0.04 (Welch’s t test)

