Fig. 5.
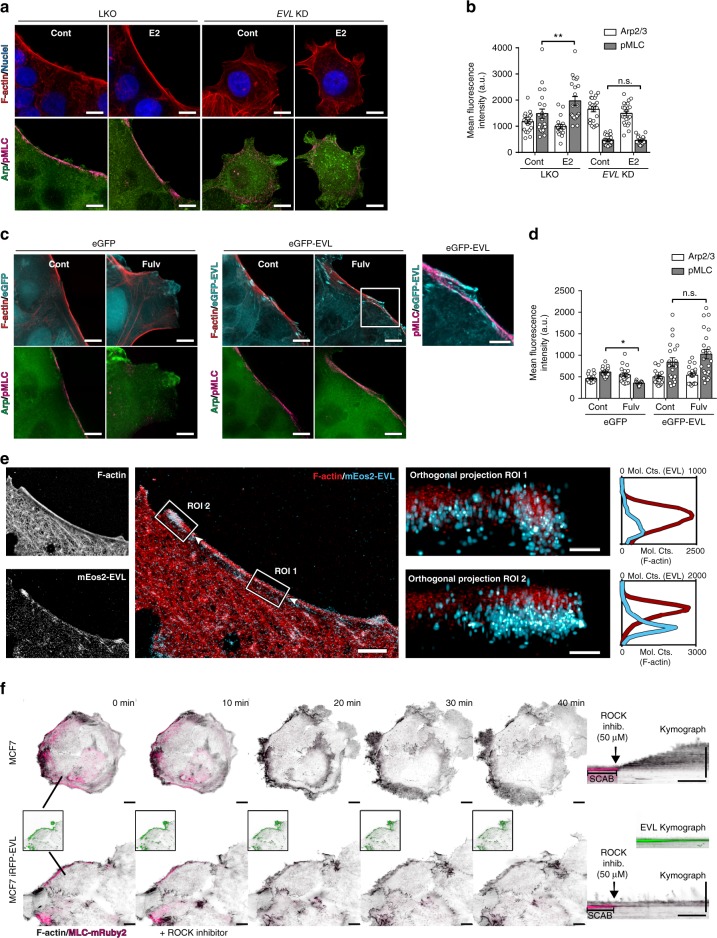
EVL promotes ER-mediated actin remodeling. a Maximum intensity projections of z-series of control and E2-treated LKO and EVL KD MCF7 cells. Scale bar is 10 µm. b Quantification of leading edge Arp2/3 and pMLC. Data from three independent experiments (n = 21 cells per group; mean ± s.e.m.). Three-way ANOVA shows significant differences between LKO and EVL KD groups at p = 0.08 (df = 1). Two-way ANOVA shows significant difference in pMLC levels at p < 0.05 between control and E2-treated cells in the LKO group, but not in the EVL KD group. No significant differences in Arp2/3 levels were observed at p < 0.05. **p < 0.01. c Maximum intensity projections of z-series of control and fulv-treated eGFP and eGFP-EVL MCF7 cells. Scale bar is 10 µm. Scale bar is 5 µm for inset showing eGFP-EVL and pMLC. Larger fields of view from the same group are given in Supplementary Fig. 5b. d Quantification of leading edge Arp2/3 and pMLC. Data from three independent experiments (n = 21 cells per group; mean ± s.e.m.). Three-way ANOVA shows significant differences between eGFP and eGFP-EVL groups at p < 0.0001 (df = 1). Two-way ANOVA shows significant difference in pMLC levels at p < 0.05 between control and fulv-treated cells in the eGFP group, but not in the eGFP-EVL group. No significant differences in Arp2/3 levels were observed at p < 0.05. *p < 0.05. e Analysis of EVL localization at SCABs by iPALM in MCF7 cells expressing mEos2-EVL. Left panels show single and merged images of F-actin staining and mEos2-EVL; boxes indicate ROIs. Arrows indicate en face orientation of orthogonal projections. Orthogonal projections of ROIs are shown with corresponding histogram highlighting z-localization of F-actin (red) and mEos2-EVL (cyan); horizontal axes represent molecular counts (mol. cts.) for mEos2-EVL (top) and F-actin (bottom). Merge image scale bar is 5 µm. Orthogonal projection scale bar is 150 nm. f Leading edge kymography in control and iRFP670-EVL (green) expressing MCF7 cells (top and bottom rows, respectively), with eGFP-Lifeact (black) and MLC-mRuby2 (magenta), before and after ROCK inhibitor (50 µM) treatment (Supplementary Movie 8). Left panels are images from time-lapse series before and after treatment. Scale bar is 10 µm. Line shows leading edge location at which kymographs were registered. Inset shows EVL channel separately. Right panel shows kymograph. Vertical scale bar is 10 µm. Horizontal scale bar is 10 min. n.s. nonsignificant

