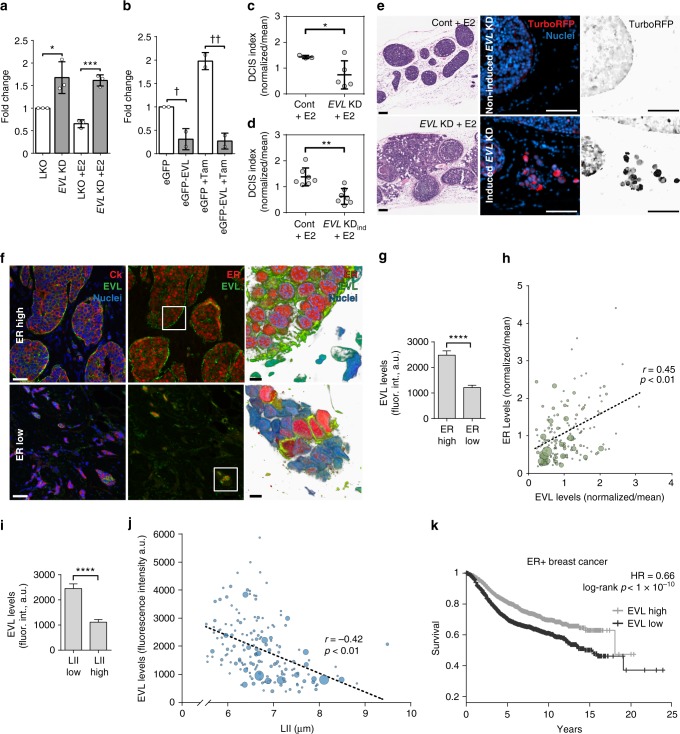
Fig. 6.
EVL suppresses invasive activity of breast cancer cells and is associated with low dissemination in breast tumors. a Fold change in invasion of LKO and EVL KD control and E2-treated MCF7 cells; mean ± s.d.; *p = 0.02, ***p = 0.004 (unpaired t test). Data are from three independent experiments. b Fold change in invasion of control and tam-treated eGFP and eGFP-EVL MCF7 cells; mean ± s.d.; †p = 0.04, ††p = 0.01 (unpaired t test). Data are from three independent experiments. c DCIS index in LKO and constitutive EVL KD MCF7 xenograft tumors treated with E2 (n = 3 mice in LKO and n = 5 in EVL KD group; mean ± s.d. *p = 0.04) (Welch’s t test). d DCIS index in control and inducible EVL KD tumors (n = 7 mice per group; mean ± s.d.; **p = 0.001) (Welch’s t test). e Representative H&E stains (left), scale bar is 500 µm; and doxycycline induction (right), scale bar is 100 µm. f Representative luminal B breast tumors with high (top) or low (bottom) ER expression (Cedars-Sinai LumB TMA). Left panels show merged images of cytokeratin (red) and EVL (green) immunolabeling and middle panels of ER (red) and EVL (green) immunolabeling. Images are maximum intensity projections of z-series. Scale bar is 50 µm. Right panels are 3D reconstructions of boxed areas, imaged at higher resolution. Scale bar is 5 µm. g Quantification of EVL levels in ER low (1st quartile) and ER high (3rd quartile) tumors; a.u. = arbitrary units; mean ± s.e.m.; ****p < 0.0001 (Welch’s t test). h Scatter plot of ER vs. EVL levels; bubble area is proportional to the number of positive lymph nodes in the corresponding patient; r is Pearson’s correlation coefficient; correlation is significant at p < 0.01; a.u. = arbitrary units. i Quantification of EVL levels in LII low (≤7 µm) and LII high (>9 µm) tumors by mean fluorescence intensity; a.u. = arbitrary units; mean ± s.e.m. ****p < 0.0001 (Welch’s t test). j Scatter plot of EVL levels and LII; bubble area is proportional to the number of positive lymph nodes in the corresponding patient; r is Pearson’s correlation coefficient; correlation is significant at p < 0.01. k Survival of ER+ breast cancer patients clustered by EVL expression (split at median). Data from KM plotter (Affy ID = 217838_s_at/gene symbol = EVL; ER status derived from gene expression). Hazard ratio (HR) and p value shown in inset (log-rank test); 1541 patients in the EVL high group, 1541 patients in the EVL low group

