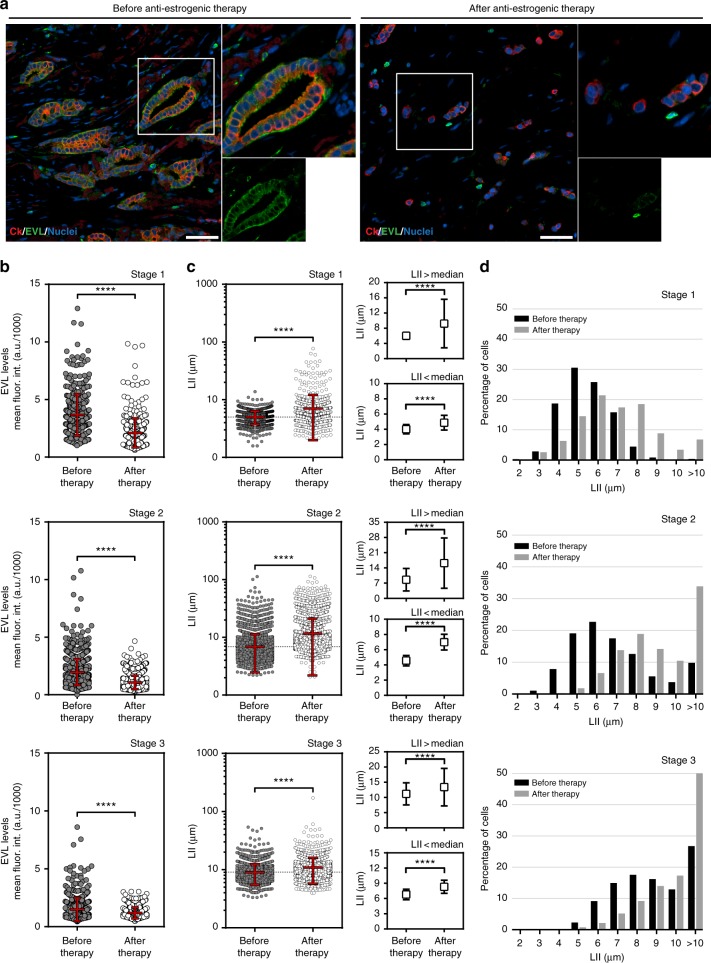
Fig. 7.
Anti-estrogenic hormone therapy is associated with decreased EVL expression and increased local invasion in tumors post-treatment. a Representative images from the same ER+ breast tumor before (left panel) and after (right panel) neoadjuvant hormone therapy. Human cytokeratin is shown in red, EVL in green, and nuclei in blue. Scale bar is 100 µm. In each panel, top-right inset shows magnification of the boxed area and bottom-right inset shows the EVL channel separately. b Quantification of EVL levels before and after hormone therapy. Scatter plots show the full range of cells analyzed within each tumor set: stage 1, n = 425 cells before and n = 422 cells after therapy; stage 2, n = 1256 cells before and n = 1185 cells after therapy; and stage 3, n = 585 before and n = 501 after therapy. Red lines represent mean ± s.d. ****p < 0.0001 (Welch’s t test). c Quantification of local invasion index (LII) before and after therapy. Scatter plots show the full range of cells analyzed within each tumor set: stage 1, n = 1259 cells before and n = 1335 cells after therapy; stage 2, n = 7113 cells before and n = 3987 cells after therapy; and stage 3, n = 2701 before and n = 2644 after therapy. Red lines represent mean ± s.d. ****p < 0.0001 (Welch’s t test); right insets show values from each scatter plot segregated into values > median and values < median (****p < 0.0001; Welch’s t test). d Histograms showing percentage of cells within different LII bins, before and after therapy

