Fig. 1.
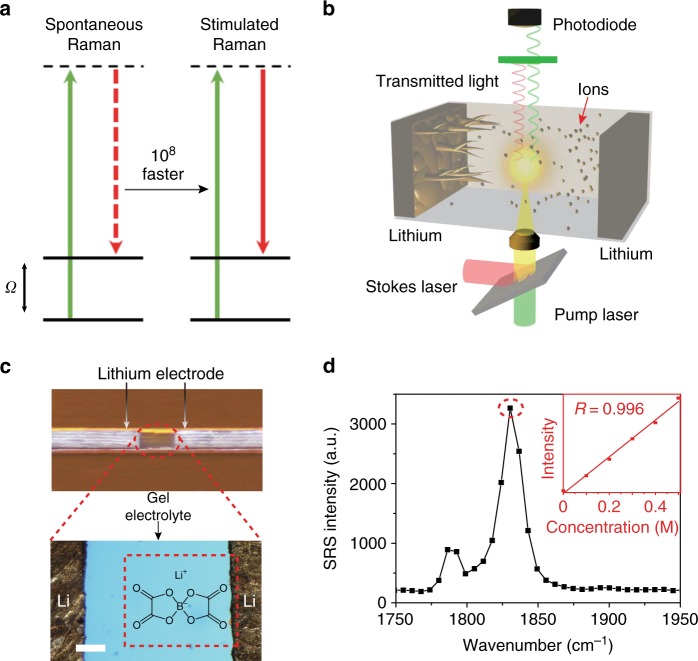
Experimental principle and design. a Energy diagrams of spontaneous Raman scattering and stimulated Raman scattering (SRS). In spontaneous Raman, only one laser (green, solid line) is used, and the scattered photons (red, dashed line) will have an energy loss of Ω, corresponding to the vibrational energy of the targeted bond. In SRS, two different lasers (green/red, solid line) with energy gaps matching Ω are simultaneously used and yield up to 108 times faster vibrational transitions. b A schematic illustration of a Li–Li symmetric cell under SRS imaging. The two lasers are the pump laser and Stokes laser. c A camera image of a Li–Li symmetric cell (top) and zoom-in microscope image (bottom). Scale bar is 100 μm. The red, dashed rectangle indicates the imaging area. The molecular structure is of the LiBOB salt used in our study. Scale bar is 100 μm. d The SRS spectrum of 0.5 M LiBOB in TEGDME/PVdF-HFP gel electrolyte. The inset shows the linear concentration dependence between the Raman intensity at 1830 cm–1 (dashed circle) and the LiBOB concentration from 0 M to 0.5 M

