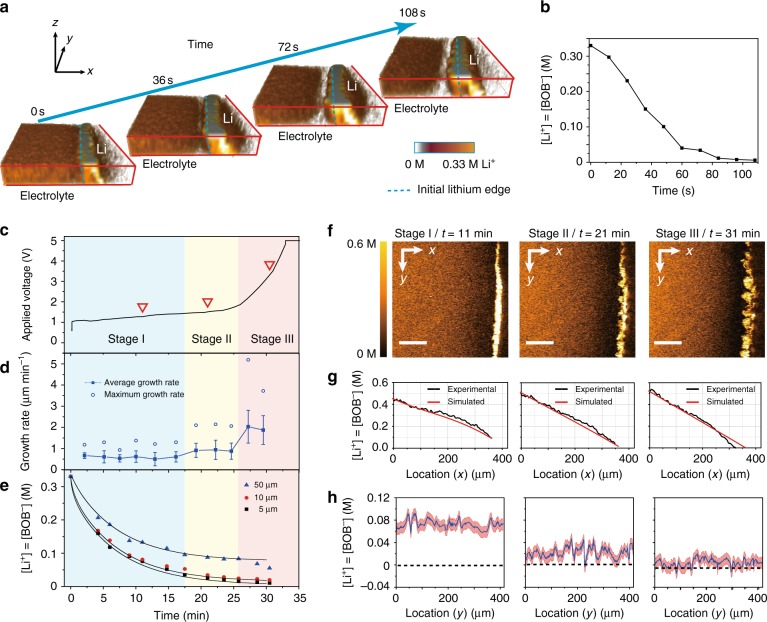
Fig. 3.
Visualization of ion transport/depletion and dendrite growth on a 2D Li electrode. a 3D images showing depletion of ions near the Li surface at a current density of 4.2 mA cm−2. The expansion of the transparent area (white) near the Li electrode indicate gradual Li+-ion depletion in the vicinity of the electrode. The imaging area is 150 μm (x) × 250 μm (y) × 50 μm (z), and the area is stretched by 66.7% along the x-axis to amplify the Li growth. b Average Li+ concentration 5 μm away from the Li surface in a. c Voltage profile of a Li/Li symmetric cell at 1.3 mA cm−2. d Li growth rate and standard deviation vs. time. The solid and empty squares represent the average growth rate (vave) and the maximum local growth rate (vmax). e Average [Li+] vs. time at 5 μm, 10 μm and 50 μm away from the electrode surface. Black lines are the fitting curves based on the Nernst–Planck equation. f Representative 2D SRS images at 11 min, 21 min and 31 min. The color bar on the left represents the [Li+] in the electrolyte. Scale bars are all 100 μm. g 1D [Li+] profile along the x-direction of the SRS 2D images in f (black lines). Red lines are the simulation results based on the Nernst–Plank equation. h Extrapolated [Li+] on the Li surface ([Li+]0 μm) along the electrode contour versus the location (y-direction). The value is determined by a linear extrapolation of all the points between [Li+]10 μm and [Li+]3 μm (Supplementary Fig. 10). The error bar in f is ±10 mM. All [Li+] in this study were measured based on [BOB–], and their difference should be less than 0.1 mM, which is much smaller than the SRS resolution in the electrolyte

