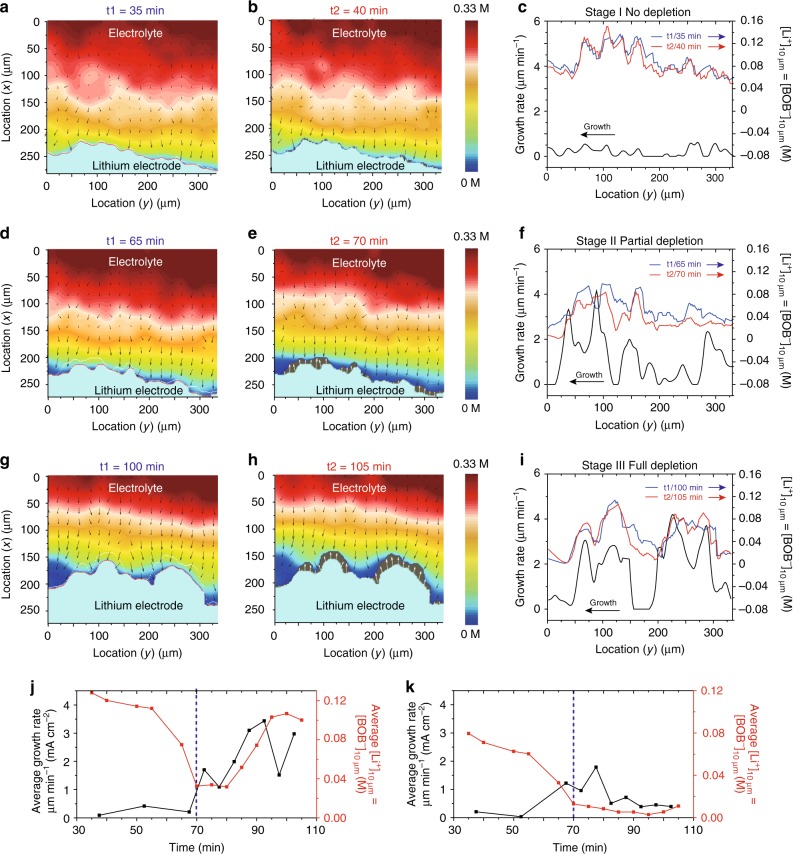
Fig. 4.
Correlation between local Li growth and local Li+ concentration. 2D overlapping images at three representative moments (t1/t2), a–c 35/40 min (stage I / no depletion), d–f 65/70 min (stage II / partial depletion), and g–i 100/105 min (stage III / full depletion). The first column exhibits the ionic concentration profile and solid Li electrode region at t1. The boundaries of the lithium electrode at t1 and t2 are labeled by red and white dash lines, respectively. The second column exhibits the [Li+] at t2. The gray region at the bottom shows the difference in the solid Li electrode between t1 and t2. The white arrows represent the dendrite growth direction and rate. The [Li+] in the electrolyte is represented by a jet color bar. The arrows in the electrolyte represent the concentration gradient in the electrolyte. Kernel smoothing was applied in a–f to reduce the noise to <10 mM (See “Methods” section and Supplementary Fig. 9). The third column (c, f, i) shows the relationship between the dendrite growth rate (black lines) and [Li+]10 μm vs. the location at t1 (blue lines) and t2 (red lines). The corresponding scattering plots are presented in Supplementary Fig. 15. j, k The relationship between the Li growth rate and [Li+]10 μm in two regions: fast growth region (j: location (y) 112–132 μm) and slow growth region. (k: location (y) 0–40 μm). Blue dashed line is at 70 min when depletion starts. All [Li+] values in this study are measured based on [BOB–], and their difference should be less than 0.1 mM, which is much smaller than the SRS resolution in the electrolyte

