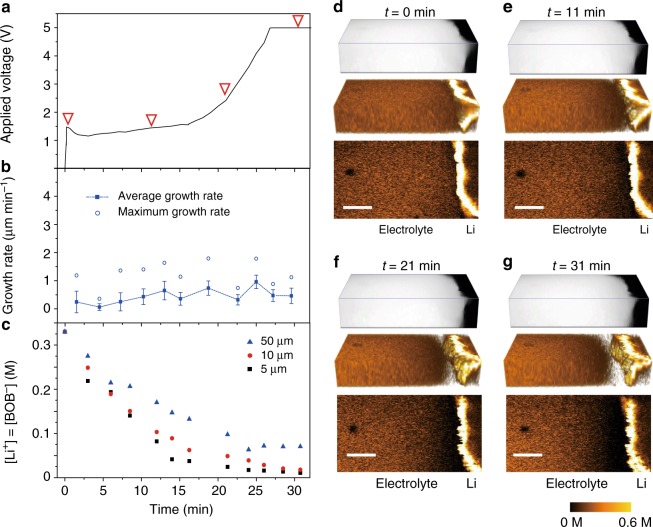
Fig. 5.
SRS analysis of a Li3PO4-coated Li electrode. a Voltage profile of a Li3PO4-coated Li–Li cell showing the voltage change vs. time. b Average growth rate and standard deviation versus time (same sizes as above). c Concentration change at 5 μm, 10 μm and 50 μm away from the electrode surface. d–g Correspond to 0 min, 11 min, 21 min and 31 min, respectively. Each time set contains a 3D image, 3D SRS image, and representative 2D SRS image from top to bottom. The depletion region in all 3D SRS images is represented by a transparent white area to enhance the visual difference

