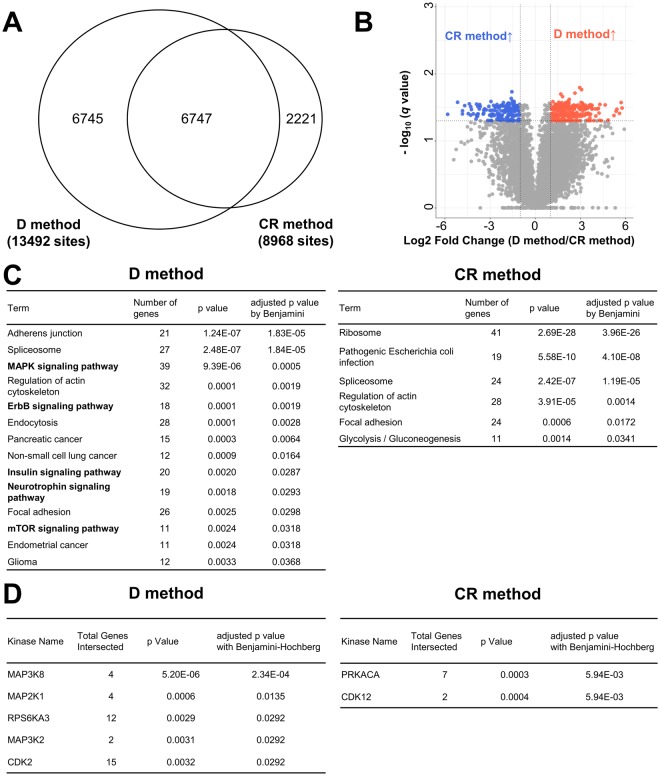
Figure 3.
Comparison of phosphosites identified using Matrigel-embedded 3D-cultured HCT116 recovered using the D and CR methods. (A) Proportional Venn diagram of phosphosites identified in all triplicate experiments from Matrigel-embedded HCT116 recovered with the D and the CR method. (B) Volcano plot of phosphosites in comparison between samples collected with the D and CR method. (blue circles: phosphosites increased in the D method samples relative to those by the CR method; red circles: phosphosites decreased in the D method samples; gray circles: phosphosites without significant differences). (C) Pathway analysis results from DAVID using significantly increased or decreased phosphosites in the samples recovered with the CR method compared to those in the samples recovered with the D method (adjusted p value < 0.05). (D) List of active kinases with significant differences by KEA (adjusted p value < 0.05).

