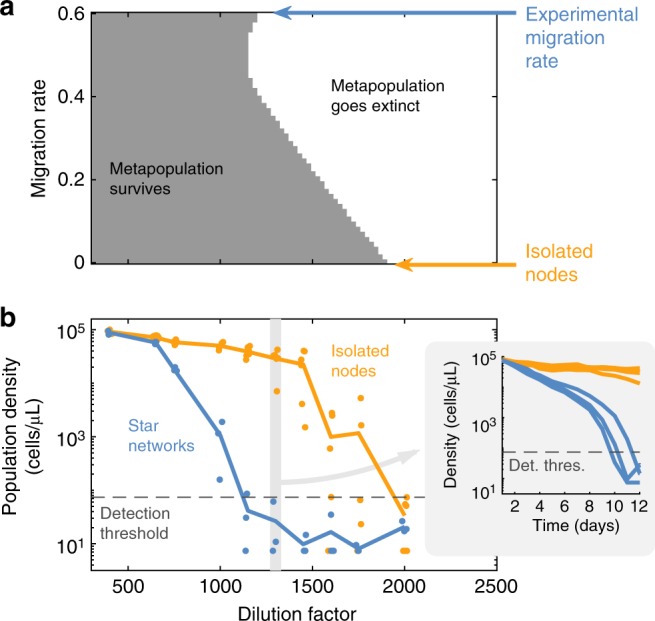
Fig. 3.

Heterogeneous metapopulations are less able to survive challenging environments than isolated populations. a The gray area indicates the conditions (dilution factor and migration rate) in which the model predicts that a 10-node star network will survive after 1000 growth/dilution/migration cycles (note that m = 0 is also equivalent to isolated nodes). The rest of model parameters are the same as in Fig. 2. b Experimental equilibrium population densities for 10-nodes star networks (blue) and isolated nodes (yellow), as a function of dilution factor. Each dot is either one network or the average of a set of 10 isolated nodes; lines are the average. Inset: Experimental time series of population densities for dilution factor 1300, for star networks (blue) and isolated nodes (yellow). Each line is either one network or the average of a set of 10 isolated nodes. See Supplementary Figure 2 for the complete time series
