Fig. 4.
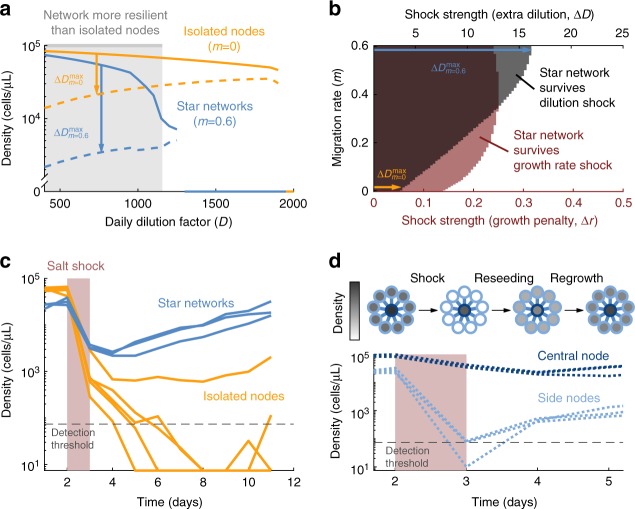
Star networks are more resilient to perturbations than isolated populations. a Bifurcation diagram for the metapopulation. Solid lines show the average population density in equilibrium as a function of dilution rate (yellow: isolated nodes; blue: 10-node star network). Dashed lines show the minimum density from which the metapopulation can recover. Arrows show the maximum dilution shock that each metapopulation can withstand (∆Dmax), when daily dilution rate is D = 750. Gray area marks the region where the star network can withstand a greater shock than the isolated nodes. Model parameters are as in Fig. 2. See Supplementary Figure 3 for a more detailed version of this figure. b Model prediction for survival of a 10-node star network with daily dilution factor D = 750 after a perturbation, as a function of perturbation strength and migration rate. Rest of parameters are as in Fig. 2. Black: Shock corresponds to one cycle with increased dilution factor, D’ = 750*∆D. Red: Shock corresponds to one cycle with reduced growth r’ = 0.5-∆r. c Experimental results showing the time evolution of the average density in star networks (blue) and isolated populations (yellow). Each line corresponds to one 10-node network or to 10 isolated nodes. All populations are subject to a 750 dilution factor and are initially in equilibrium. They are then perturbed by a salt shock (32 g/L concentration of NaCl, shaded in red). d Top: Cartoon of star network recovering from a perturbation. Grayscale indicates population density in every node. Bottom: Same as b, but only for the star network and separating the center and side nodes

