Figure 2.
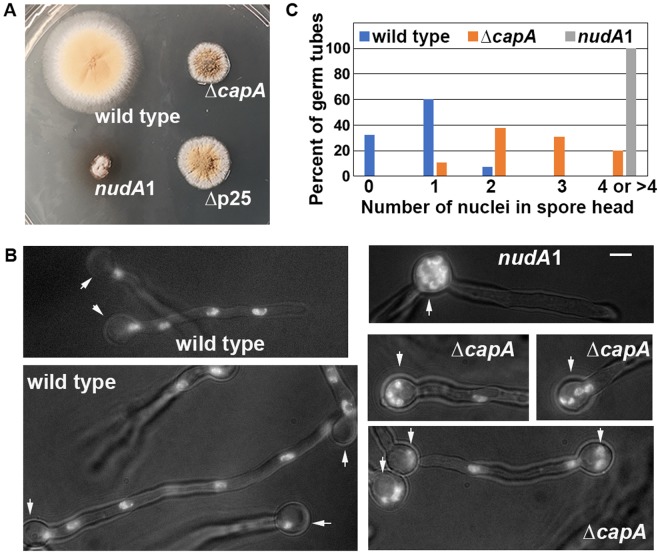
Colony and nuclear-distribution phenotypes of the ∆capA mutant. (A) Colony phenotypes of the ∆capA mutant and control strains including wild type, the nudA1 mutant and ∆p25 mutant. The plate was incubated at 37 °C for 2 days. (B) Images showing the nuclear distribution phenotype of the ∆capA mutant in comparison with that of wild type or the nudA1 mutant. Cells were grown at 37 °C for ~8 hours in MM + glucose medium. Bar, 5 μm. (C) A quantitative analysis on the percentage of germ tubes containing 0, 1, 2, 3 or ≥4 nuclei in the spore head. In the wild-type control strain, 60.3% of the germ tubes contain one nucleus, 32.4% contain no nucleus and 7.3% contain two nuclei in the spore head (n = 68). In the ∆capA mutant, 10.7% contain one nucleus, 38.1% contain two nuclei, 31% contain three nuclei, 17.8% contain four nuclei and 2.4% contain five nuclei in the spore head (n = 84). The mean ranks of these two sets of data are significantly different at p = 0.05 (the actual p-value is smaller than 0.000000000000001, two-tailed) based on a nonparametric test that assumes no information about the distribution (unpaired, Mann-Whitney test, Prism 7 for Mac OS X, version 7.0c, 2017). In the nudA1 mutant, 100% of the germ tubes (n = 50) show a cluster of 4–8 nuclei in the spore head, and we express the number as “4 or >4” because the exact number of nuclei in the cluster is hard be determined accurately.

