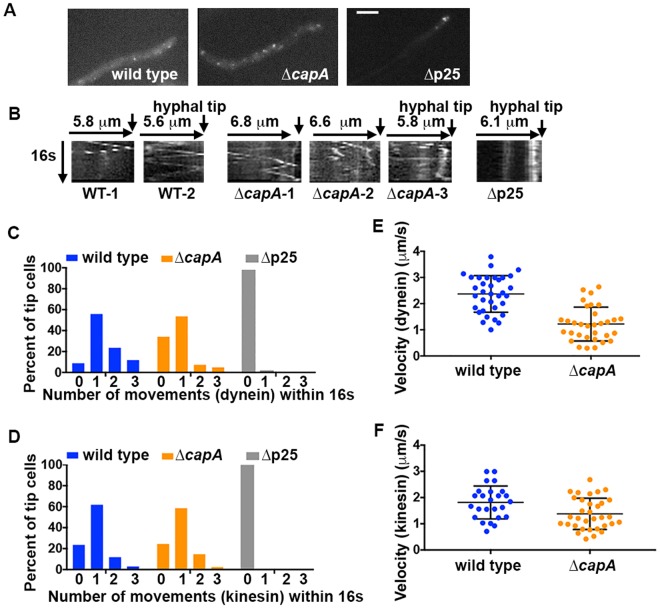
Figure 6.
A quantitative analysis of dynein-mediated early endosome movement upon loss of CapA. (A) Images showing TagGFP2-RabA-labeled early endosomes in wild type, the ∆capA mutant and the ∆p25 mutant. Cells were cultured for overnight at 37 °C in MM + glycerol medium. Bar, 5 μm. (B) Kymographs showing early endosome movements. Two kymographs are shown for wild type (WT-1 and WT-2) and three are shown for the ∆capA mutant (∆capA-1, ∆capA-2, and ∆capA-3). A ∆p25 kymograph is shown as a control as there is no diagonal lines that indicate movements. For each kymograph, position of the hyphal tip is on the right side and indicated by a short arrow (the word “hyphal tip” is on the last kymograph for each strain). (C) Percent of hyphal-tip cells (called “tip cells” for simplicity) showing different numbers of dynein-mediated early endosome movement events within 16 seconds (n = 34 for wild type and n = 41 for the ∆capA mutant). The mean ranks of the wild type and ∆capA numbers of events are significantly different at p = 0.05 (p = 0.0022, two-tailed). (D) Percent of hyphal-tip cells showing different numbers of kinesin-3-mediated early endosome movements within 16 seconds (n = 34 for wild type and n = 41 for the ∆capA mutant). The mean ranks of the wild type and ∆capA numbers of events are not significantly different at p = 0.05 (p = 0.962, two-tailed). (E) Velocity of dynein-mediated early endosome movement in wild type and the ∆capA mutant (n = 34 for wild type and n = 32 for the ∆capA mutant). The mean ranks of the two sets of values are significantly different at p = 0.05 (p = 0.000000008666721, two-tailed). (F) Velocity of kinesin-3-mediated early endosome movement in wild type and the ∆capA mutant (n = 25 for wild type and n = 33 for the ∆capA mutant). The mean ranks of the two sets of values are significantly different at p = 0.05 (p = 0.013, two-tailed). Scatter plots with mean and SD values were generated by Prism 7. All the statistical analyses were done using nonparametric tests assuming no information about the distribution (unpaired, Mann-Whitney test, Prism 7).

