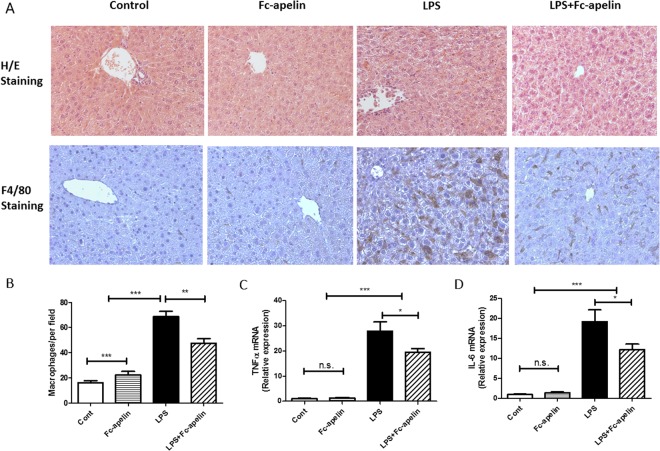
Figure 4.
Fc-apelin ameliorates LPS-induced liver damage and inflammation responses. (A) Representative H/E staining and immunohistochemistry of macrophage marker F4/80 of liver sections. (B) Quantification of F4/80 + cells per view (200 x magnification). Quantitative PCR (qPCR) of gene expression for TNFα (C) and IL-6 (D). Gene expression is normalized with β-actin. Data are expressed as mean + SE; n = 5 for microphage infiltration analyses and n = 8 for qPCR; *p < 0.05; **p < 0.01; ***p < 0.001 and n.s.: no significance.

