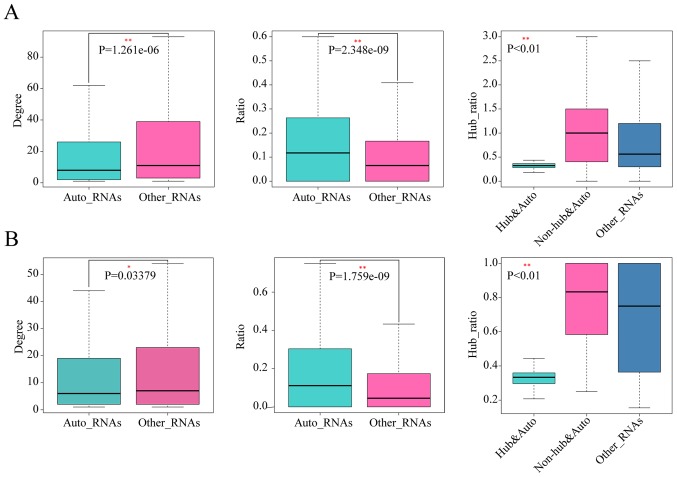
Figure 2.
Analyses of autophagy genes and other genes within colorectal cancer ceRNA networks. Results for (A) COAD and (B) READ show the degree of autophagy genes and non-autophagy genes (left panel), the ratios of autophagy genes to non-autophagy genes in the neighbors of autophagy genes and non-autophagy genes (ratio = number of autophagy genes in neighbors / number of non-autophagy genes in neighbors) (middle panel), and the comparison of ratios of non-autophagy and hub genes to non-autophagy and non-hub genes in the neighbors among hub and autophagy genes, non-hub and autophagy genes and other genes in ceRNA networks (ratio = number of non-autophagy and hub genes in neighbors / number of non-autophagy and non-hub genes in neighbors) (right panel). The P-value was calculated by the Wilcoxon rank sum test (left and middle panels) or Kruskal-Wallis test (right panels). *P<0.05; **P<0.01. Auto_RNAs, autophagy genes; Other_RNAs, non-autophagy genes; Hub&Auto_RNAs, autophagy and hub genes; Non-hub&Auto_RNAs, autophagy and non-hub genes; COAD, colon adenocarcinoma; READ, rectal adenocarcinoma; ceRNA, competing endogenous RNA.

