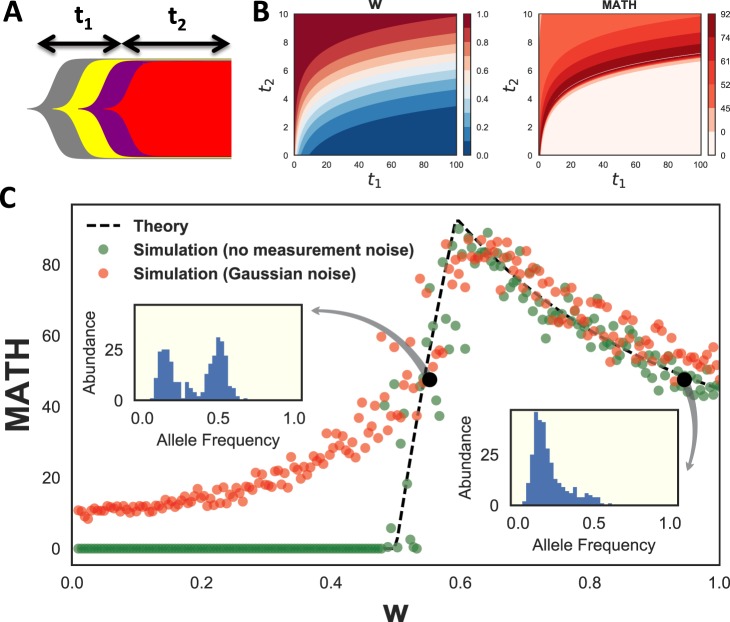
Figure 5.
Theoretical analysis of MATH score. (A) Schematic diagram of linear tumor evolution model. is the time from the common ancestor of all tumor cells until the last selective sweep. is the time from the last selective sweep until biopsy. (B) Contour plots of neutral fraction, , and MATH as a function of and for a noiseless exponentially growing model of linear evolution. is the fraction of total SNVs that occurred after the last selective sweep. For this growth model, , where time is measured in cell cycles. (C) MATH score as a function of neutral fraction, , for a linear tumor evolution model. Dashed lines correspond to analytical calculations. Green dots are samples from the model with 300 SNVs. Red dots are simulated results after incorporation of Gaussian measurement noise. Insets correspond to simulated allele frequency distributions for the two black circles, which have equal MATH scores.

