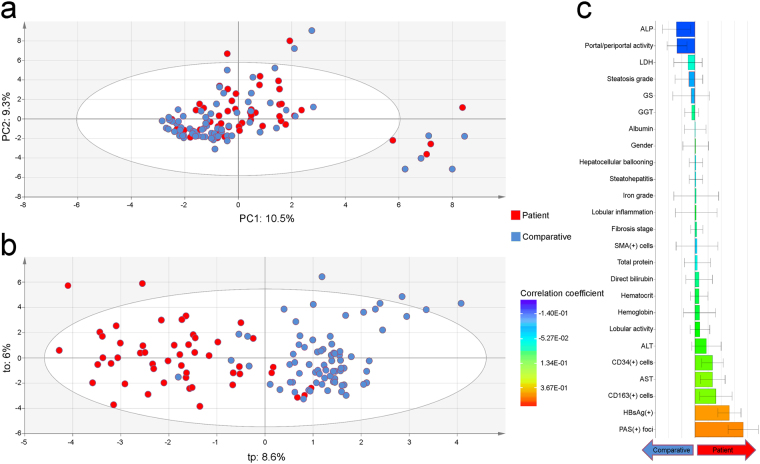
Figure 2.
Exploratory multivariate data analysis of non-tumor liver features in both Peruvian patients with hepatocellular carcinoma and comparative individuals. (a) Unsupervised PCA score plot (PC1: 10.5% versus PC2: 9.3%) displaying a blended assemblage of HCC patients and comparative individuals. The scattered cluster located outside the Hotelling’s T2 limits on the lower right corner plots individuals with hepatocellular ballooning and steatohepatitis. (b) OPLS-DA score plot for the first predictive (tp: 8.6%) versus orthogonal (to: 6%) components showing dissociation between HCC patients and comparative individuals. The performance of the prediction model was satisfactory (R2Y = 0.68; Q2Y = 0.53). (a,b) HCC patients and comparative individuals are plotted in red and blue, respectively. (c) Regression coefficient plot for the OPLS-DA model with biomedical features of both HCC patients and comparatives individuals. Right coefficient boxes indicate a correlation with Patient Group and left coefficient boxes a correlation with Comparative Group; coefficient box color gives an indication about the degree of correlation; and error bars represent the Jack-knife standard error of the Y loading weight vector computed from the rounds of cross validation.

