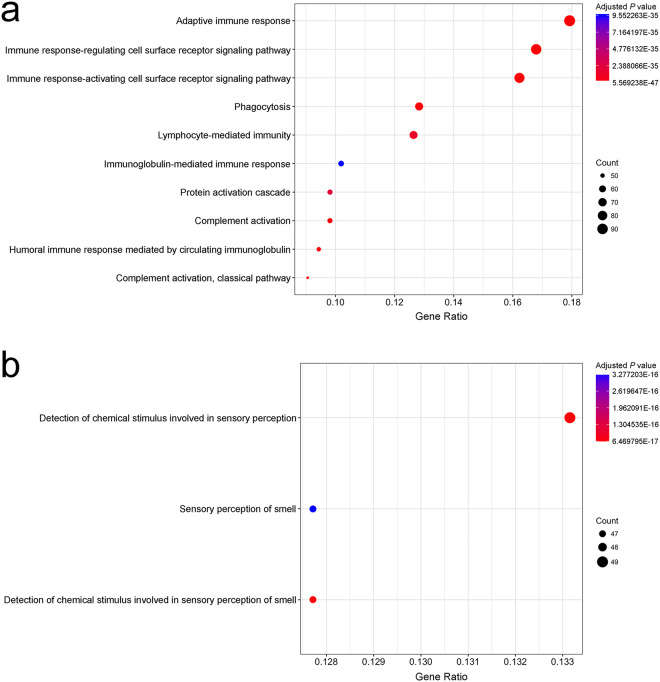
Figure 4.
Gene ontology enrichment analysis on expression dataset of non-tumor livers with and without PAS positive hepatic foci of cellular alteration. (a) Point plot representation of the ontologies downregulated in PAS(+) NTL compared to PAS(−) NTL of Peruvian HCC patients. (b) Point plot representation of the ontologies upregulated in PAS(+) NTL compared to PAS(−) NTL of Peruvian HCC patients. (a,b) X-axis shows Gene Ratio of each term and Y-axis shows the Gene Ontology pathway terms; point size scales the gene count; and point color illustrates the adjusted P value.

