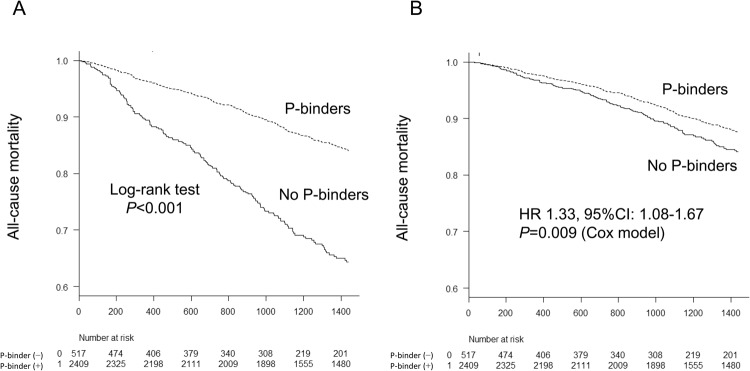
Figure 3.
Kaplan-Meier analysis for the all-cause mortality between phosphate-binder users and non-users. (A) Non-adjusted curve. (B) Multivariable-adjusted curve. Log-rank test was used to compare the survival curve between the two groups in non-adjusted curve. Adjustment using Cox proportional hazard model was performed for baseline characteristics (age, sex, presence of diabetes mellitus and comorbidity, dialysis vintage, dialysis time per session, Kt/V for urea, normalized protein catabolic rate, body mass index, cardiothoracic ratio, systolic blood pressure, blood hemoglobin level, serum levels of urea nitrogen, creatinine, albumin, total cholesterol, C-reactive protein, corrected calcium, phosphate, parathyroid hormone, alkaline phosphatase, and use of erythropoiesis stimulating agents, anti-hypertensives, and vitamin D receptor activators. The relative hazards risk and 95%Ci in patients without P-binders compared with those with P-binders were described in the figure. A two-tailed P-value < 0.05 was considered to be statistically significant. Abbreviations: CI, confidence interval; HR, hazard ratio; P, phosphate.

