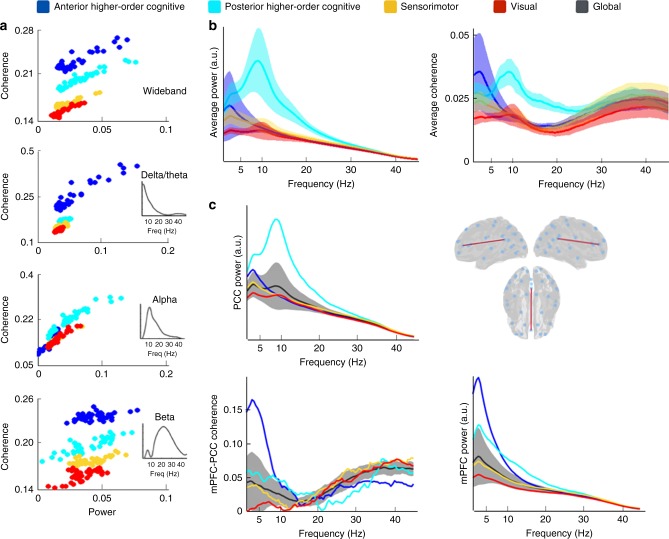
Fig. 3.
The higher-order cognitive states have distinct spectral features compared with the other states. a Total connectivity of each region (defined as the sum of the values of coherence of the region with the rest of the regions) against power, for wideband and the three estimated frequency modes (see Methods), where each dot represent a different brain region. Both power and connectivity are higher for the higher-order cognitive than for the visual and motor states, with coherence exhibiting the largest difference. b Spectral profiles of the two higher-order cognitive (anterior and posterior) and the visual and motor states, in terms of power averaged across brain regions (left) and coherence averaged across all pairs of brain regions (right); shaded areas represent the standard deviation across brain regions (or pairs of regions). Supplementary Fig. 5 shows the power spectra for the anterior/posterior precuneus alongside the PCCs. c Power for PCC (top left), power for mPFC (bottom right) and coherence between mPFC and PCC (bottom left) for the four considered states in comparison to the grand average (black line, with the shaded areas representing standard deviation across states). The temporally average global power and coherence has a relative lack of spectral detail compared with the individual brain states

