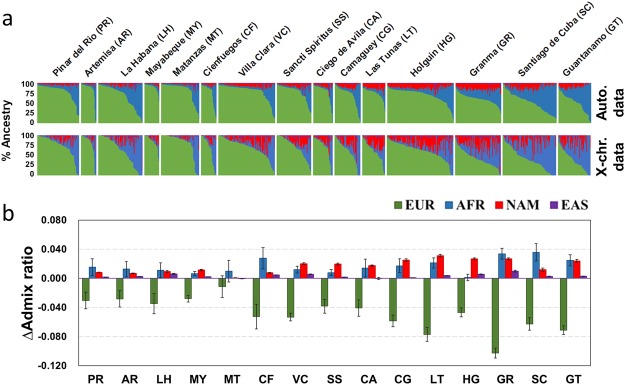
Figure 3.
Sex-specific admixture patterns in Cuba. (a) Bar-plots of individual ancestry proportions across Cuban provinces estimated using RFMix (EM = 2) on the basis of autosomal (top; Auto.) and X-chromosome (bottom; X-chr.) data. Each vertical line represents one individual based on individual fractions for European (EUR), African (AFR), Native American (NAM), and East Asian (EAS) ancestry. (b) ΔAdmix ratios in all the fifteen Cuban provinces show different sex-specific admixture patterns across the island. Bar-plots for each ancestry were plotted with respective confidence intervals (95% CI).

