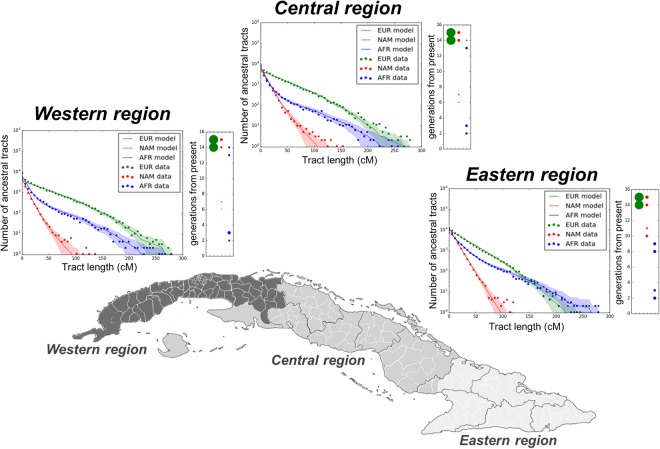
Figure 5.
Time-frame of admixture events estimated in Cuba using TRACTS analysis. Figure showing the best-fitting model based on length distributions of ancestry tracts within each Cuban region, allowing for one European, two African, and two Native American migration events. The data points represent the observed distribution of ancestry tracts estimated using RFMix (EM = 2), while solid-coloured lines represent the distribution from the predicted model, and shaded areas indicating confidence intervals (68.3% CI) of the predicted model. The admixture timing of the best-fitting model is displayed to the right of each graph. Sizes of the dots represent inferred average proportions for each ancestry (see Supplementary Table S10). Best-fitting models were selected based on the strength of the log-likelihood of each Cuban region (−566.7 in Western, −553.2 in Central, and −505.8 in Eastern region).

