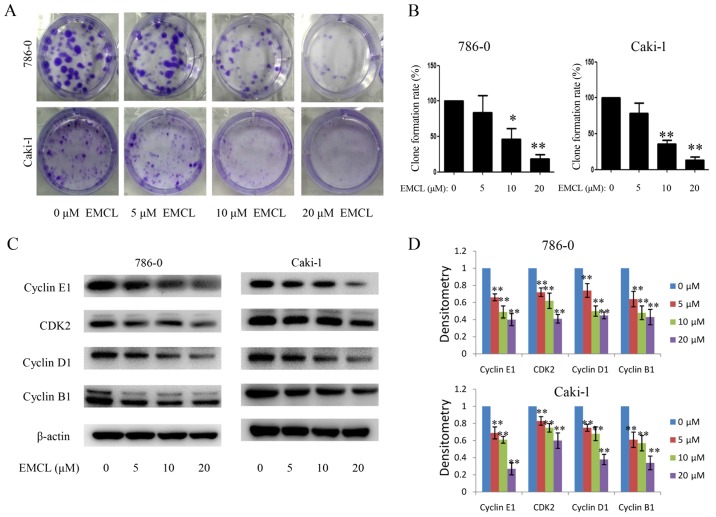
Figure 2.
Effects of treatment with EMCL on cell cycle progression. 786-0 and Caki-1 cells were treated with EMCL at the indicated doses. (A) 786-0 and Caki-1 cells were treated with EMCL at the indicated doses for 24 h and images of colony formation of cells was captured. (B) Colony formation rate was calculated. (C) Protein expression levels of cyclin E1, CDK2, cyclin D1 and cyclin B1 were analyzed by western blot analysis. (D) Quantitative analysis of the proteins was performed. Data are presented as the means ± standard deviation of three independent experiments. *P<0.05 and **P<0.01, vs. dimethyl sulfoxide-treated group. EMCL, epoxymicheliolide; CDK2, cyclin-dependent kinase 2.

