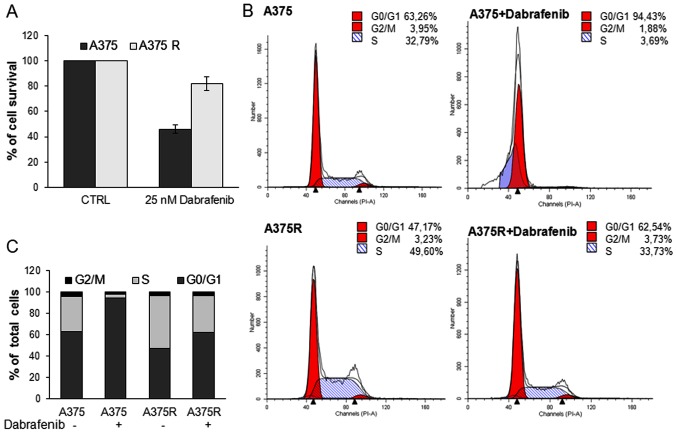
Figure 4.
Comparison of the proliferation rate and apoptotic responses to dabrafenib of A375 and A375R melanoma cells. The A375 and A375R cells were exposed to 25 nM dabrafenib for 24 h. (A) Cell viability was assessed by MTT assay. Data are the means ± SD of 3 experiments performed in triplicate. (B) The distribution of cells in the different cycle phases was analyzed by flow cytometry. (C) Histograms represent the percentages of different cycle phases.

