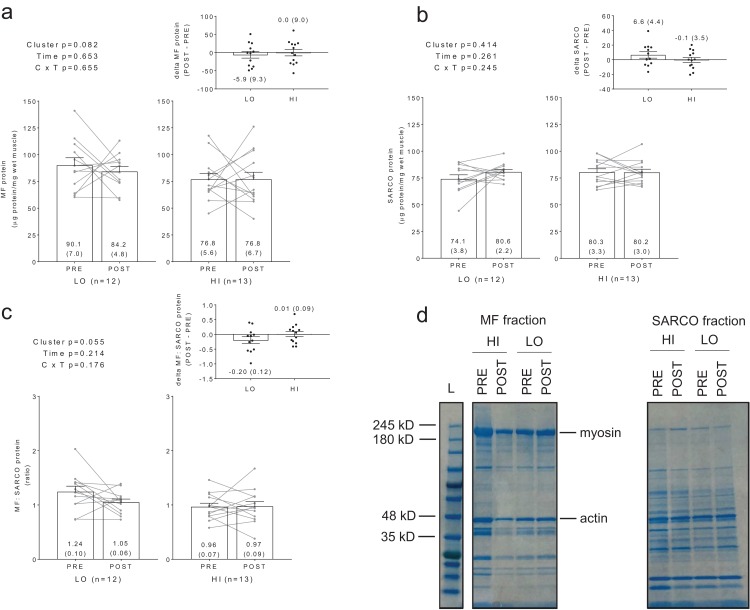
Figure 2. Differences in myofibril and sarcoplasmic protein concentrations between clusters prior to and following training.
No significant main effects or cluster × time interactions existed for myofibrillar (MF) protein concentrations (A), sarcoplasmic (SARCO) protein concentrations (B), or MF: SARCO ratios (C). All bar graph data are presented as means ± parenthesized standard error values, and bars are overlaid on individual responses. Additionally, POST—PRE values are presented as insets on (A–C). (D) is a representative image from HI and LO subjects demonstrating a Coomassie stain of isolated MF and SARCO proteins.

