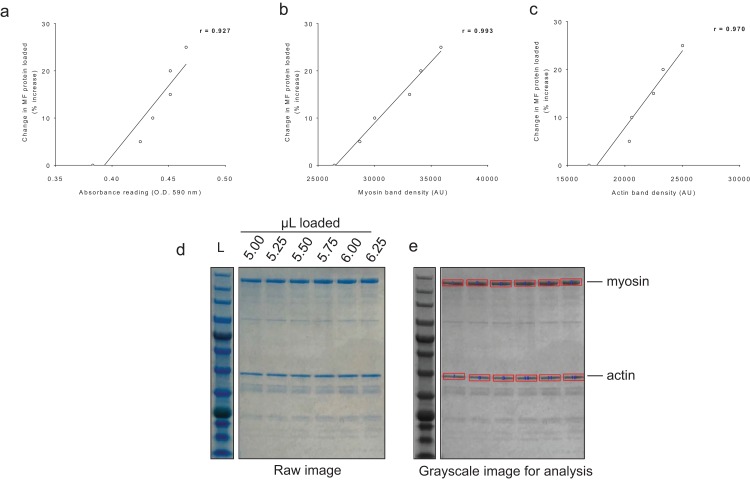
Figure 4. Sensitivity of BCA and Coomassie stain for detecting protein changes.
(A) depicts BCA assay data of increasing myofibril isolate (y-axis) plotted against absorbance readings (x-axis). (B and C) depict increasing myofibril isolate (y-axes) plotted against myosin and actin band densitometries, respectively (x-axes). Collectively, these data indicate that small changes in protein content (i.e., within 25% changes) can be accurately assessed using these assays. Experimental details of these sensitivity assessments are provided in the methods. (D) illustrates a digital image captured for the myosin and actin sensitivity assays. (E) depicts the raw image converted to grayscale with red rectangles being a software tool feature used to extrapolate total band density.

