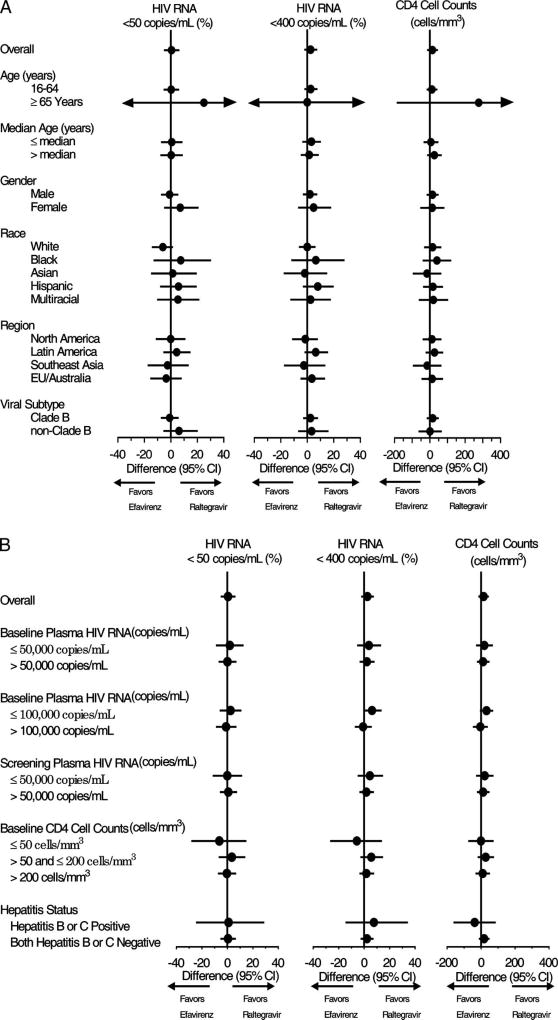
FIGURE 2.
Forest plots showing the between-treatment group differences in the proportions (%) of patients with vRNA <50 copies per milliliter and vRNA <400 copies per milliliter alongside the mean change from baseline CD4 cell counts (cells/mm3) at week 96 by (A) subpopulations and (B) prognostic subgroups at baseline. Point estimates of treatment effects with 95% CIs are presented in Forest plots to provide an estimate of treatment effects at week 96 in subpopulations and prognostic subgroups identified at baseline using the observed failure approach to missing data. The vertical line indicates no treatment difference. For reference, the overall treatment effect is given for each parameter at the top of the graph. The 95% CIs were calculated using the method of Miettinen and Nurminen.15 The arrowheads on the horizontzal bars indicate that the 95% CIs exceed the scale used for the x axis.

