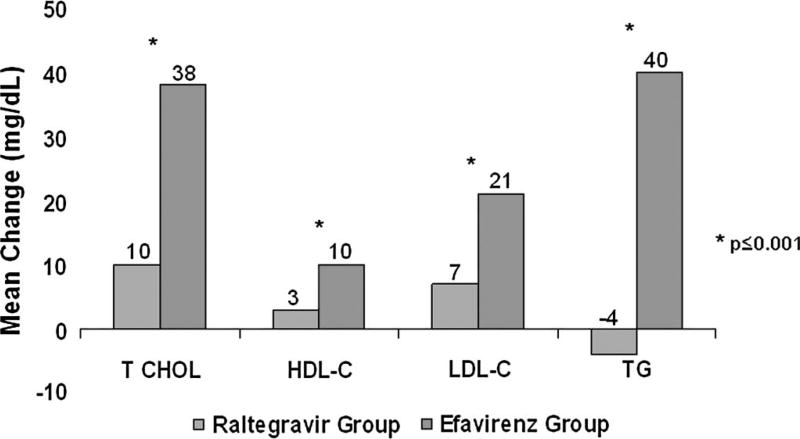
FIGURE 3.
Changes in lipid values over the first 96 weeks of therapy by treatment group. The graph shows the mean change from baseline to week 96 in total cholesterol, HDL-cholesterol, LDL-cholesterol, and TG in mg/dL between the raltegravir group (left column) and the efavirenz (right column). All 4 between-group comparisons were significantly different (P ≤ 0.001). The mean change in the total cholesterol:HDL-cholesterol ratio did not significantly differ between the raltegravir group (−0.18) and efavirenz group (0.04) (P = 0.192). HDL, high-density lipoprotein cholesterol; LDL, low-density lipoprotein cholesterol; TG, triglyceride.

