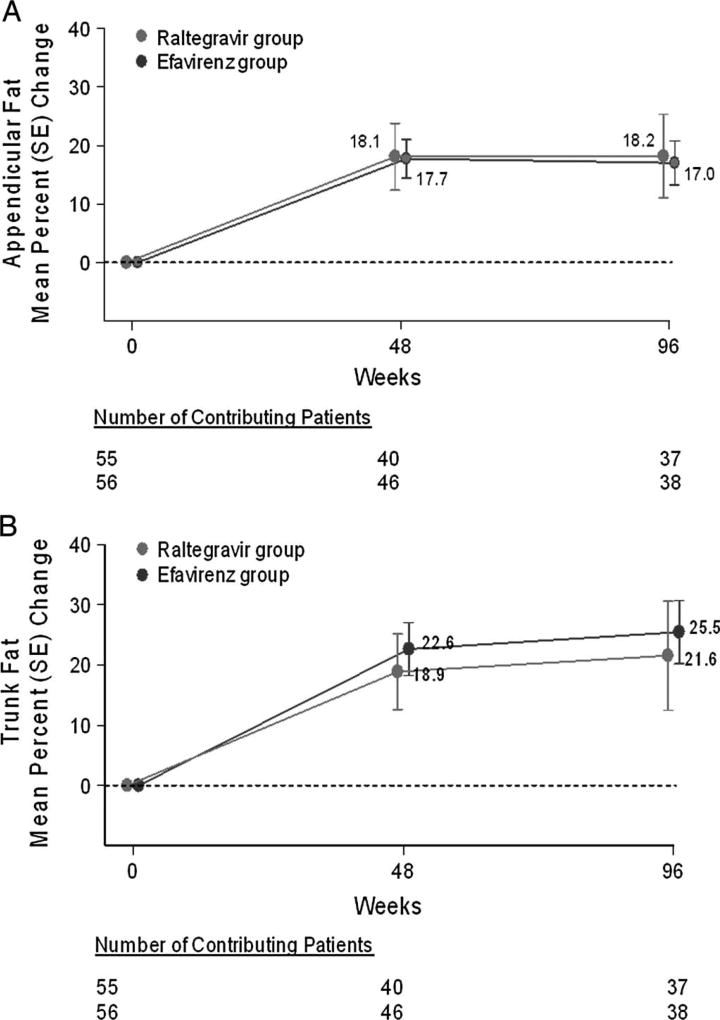
FIGURE 4.
Mean percent changes in body fat over time by treatment group. The graph displays the mean percent change from baseline in appendicular (A) and trunk (B) fat at week 48 and week 96. Measurements were made by DEXA. The mean % change in fat content from baseline was calculated as the difference between the measurements at baseline and at the specified time point (week 48 or week 96). The number of evaluable patients is shown for the treatment groups below each time point. Bars represent standard errors. There were 111 patients with DEXA scans at baseline; 86 patients had repeat scans at week 48; and 75 patients had repeat scans at week 96, including 68 patients evaluable at both time points. Repeat DEXA scans at the baseline visit were used as the baseline measurements in 7 patients for whom the original baseline scans were not available. Baseline total fat content was 20.4 kg and 17.5 kg for the raltegravir and efavirenz participants, respectively (Δ = 2.9 kg).

