
FIG. 4.
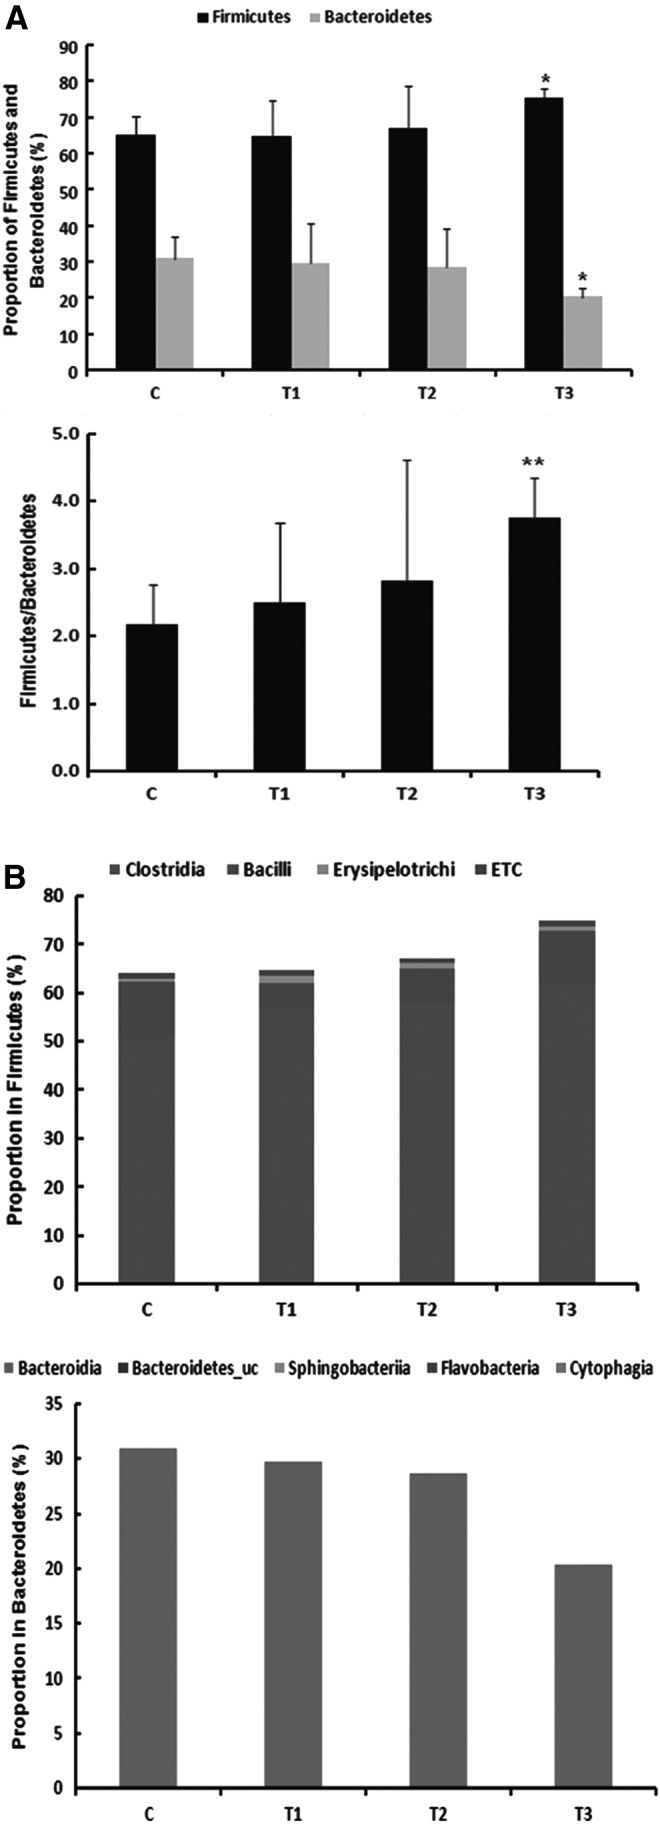
Pyrosequencing analysis of the fecal microbiota composition from mice fed the probiotics mixture and sodium butyrate. (A) Relative abundance ratio of Firmicutes and Bacteroidetes in fecal microbiota. (B) Population of Firmicutes and Bacteroidet at class level. *Means are significantly different within the same row (P < .05), **Means are significantly different within the same row (P < .01). C, control; T1, probiotic mixture group (2% wt:wt 2 × 10⁹ CFU/g-L. casei, L. rhamnosus, L. plantarum, B. lactis+allergy inducer); T2, sodium butyrate group (100 mM/0.2 mL-sodium butyrate+allergy inducer); T3, probiotic mixture+sodium butyrate group (probiotic mixture+sodium butyrate+allergy inducer).