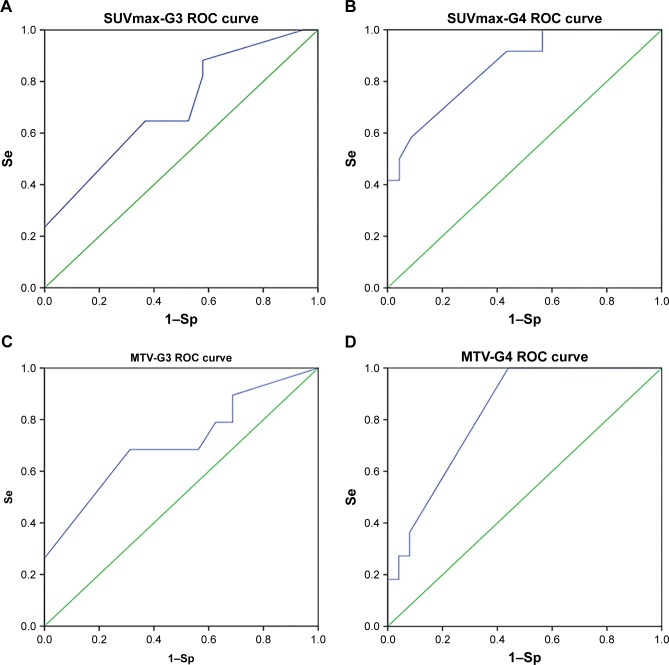
Figure 3.
ROC curve in (A) SUVmax-G3, (B) SUVmax-G4, (C) MTV-G3, and (D) MTV-G4.
Notes: The green line represents reference axis. The blue line represent ROC curve radiotherapy dose.
Abbreviations: ROC, receiver-operating characteristic; SUVmax, maximum standardized uptake value; MTV, metabolic tumor volume; G, group; Se, sensitivity; Sp, specificity.

