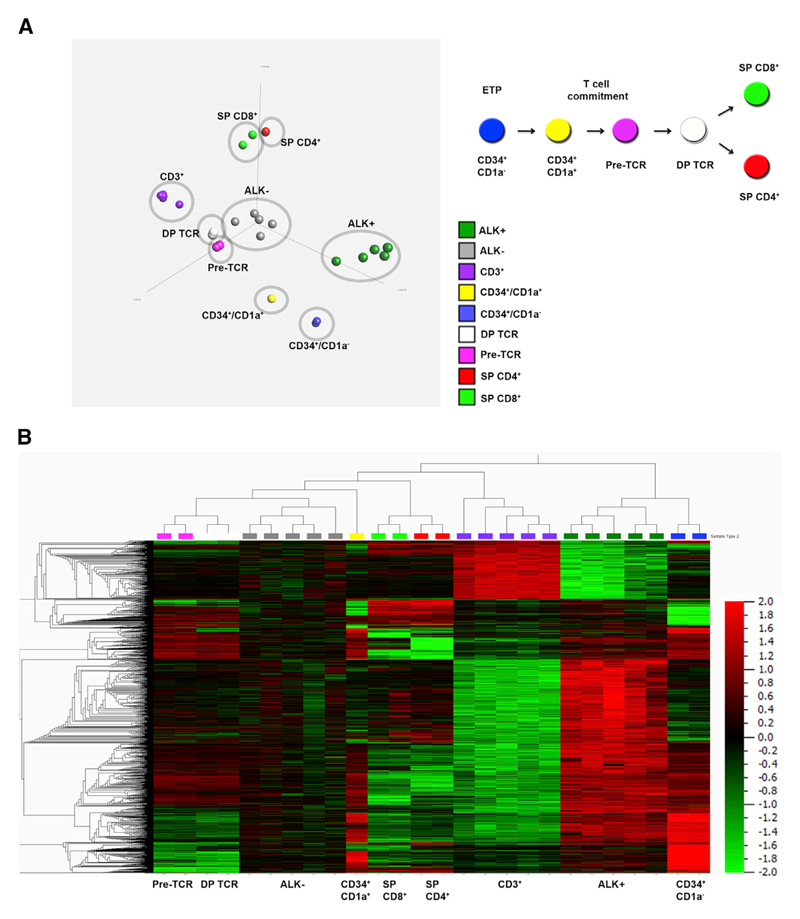
Figure 2. Comparison of Different Developmental Stages of Thymocytes with ALCL Tumor Cells.
(A) Left panel: principal-component analysis of thymic T cell subsets in comparison to ALK+ and ALK− tumor cells and peripheral CD3+ T cells (p < 9.4e–6, q value = 9.46e–4). Right panel: thymic developmental stages from ETPs (CD34+/CD1a−) to SP CD4+ or CD8+ cells.
(B) Hierarchical clustering of the top 1% of all probes of thymic subsets, ALK+ and ALK− tumor cells, and peripheral CD3+ T cells (4,817 CpG sites) (p < 9.4e–6, q value = 9.46e–4). Data were normalized using Qlucore software, as described in the Supplemental Experimental Procedures. Global normalization was used to center the β values for each sample to a mean of 0 (variance = 1) to adjust for differences in signal intensities of the different Infinium BeadChips. Color key from green = −2 (0% methylation) to red = +2 (100% methylation).

