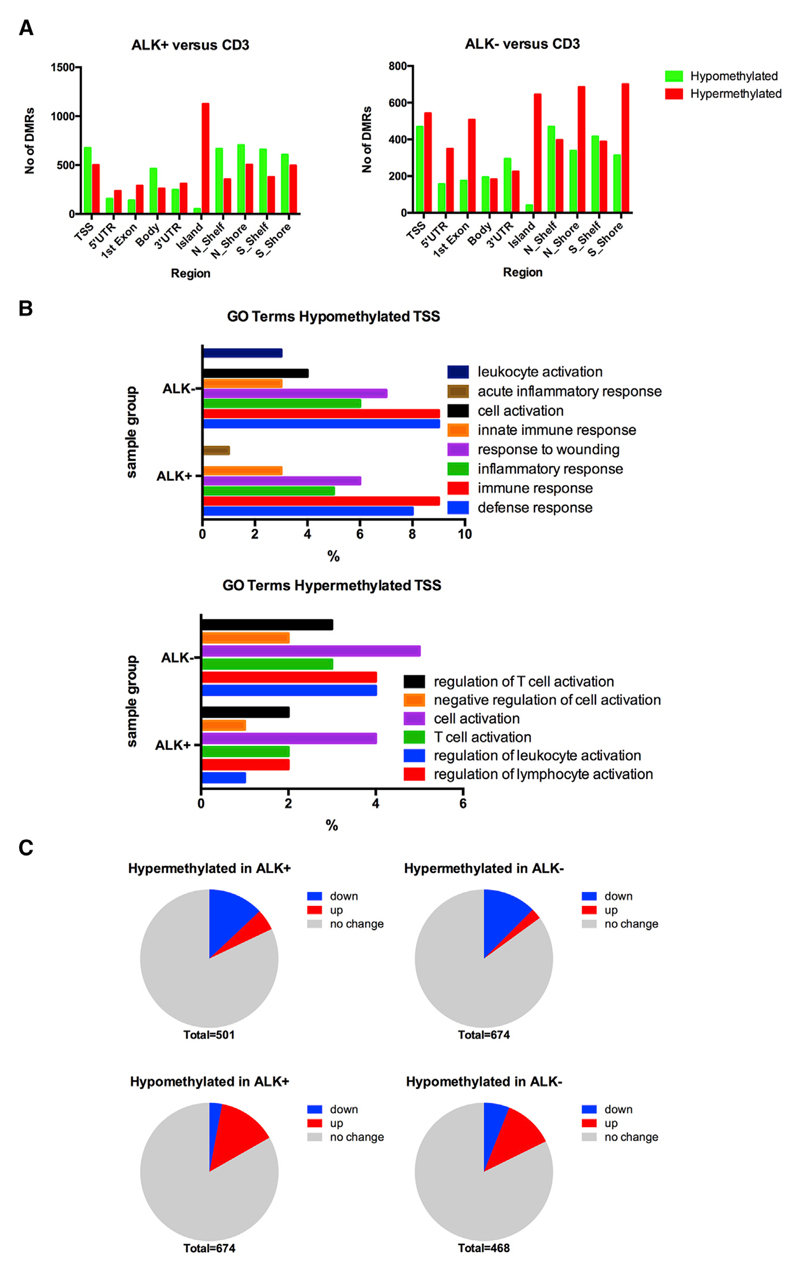
Figure 5. Characterization of DMRs.
(A) Identification of DMRs, calculated from mean β values of all CpGs annotated to a distinct genomic region, between ALK+ (left) and ALK− (right) versus CD3+ T cells (p value < 0.05; β-value difference ≥ 0.15). TSS includes CpGs within either 200 or 1,500 bp of the TSS. Hypermethylated DMRs are depicted in red; hypomethylated DMRs are in green.
(B) GO term analysis using the DAVID web-based tool. Significant GO terms (adjusted p < 0.05) are highly similar in ALK+ and ALK− tumors.
(C) Correlation of genes with differentially methylated promoters with gene expression profiles of ALK+ and ALK− ALCL and T cells. Blue, genes downregulated in ALCL versus T cells; red, genes upregulated in ALCL versus T cells.
Hypermethylated TSS, genes showing higher methylation in both groups within their promoters; hypomethylated TSS, genes with lower methylation in their promoters in both groups. See also Tables S1, S2, and S3.

