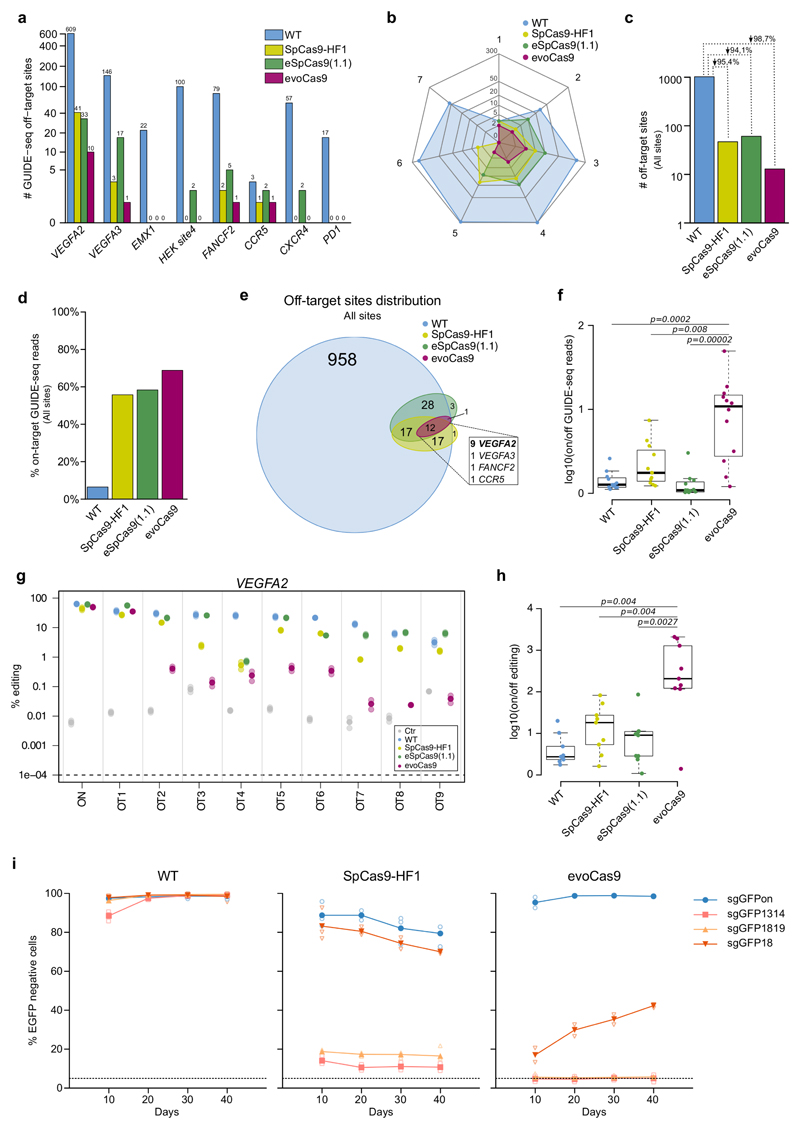
Figure 3. evoCas9 shows unprecedented specificity.
(a-f) GUIDE-seq based comparative analyses of evoCas9, wild-type SpCas9 (WT), SpCas9-HF1, and eSpCas9(1.1) for eight sgRNAs. (a) Total number of off-target sites for each of the tested sgRNA (see Supplementary Fig. 5-6 and Supplementary Data 1-2). (b) Radar plot showing the distribution of the number of mismatches (from 1 to 7) for the off-targets detected by GUIDE-seq. (c) Total number of off-target sites for each type of SpCas9 captured by GUIDE-seq with all the tested sgRNAs. (d) Global on-target cleavage specificity expressed by the percentages of the on-target reads captured by GUIDE-seq with tested sgRNAs. The on-target specificities for each site are reported in Supplementary Fig. 7. (e) Venn diagram showing the intersection among all the off-targets identified by GUIDE-seq. The inset reports the distribution of the off-target sites shared by wild-type SpCas9, SpCas9-HF1, eSpCas9(1.1) and evoCas9. (f) On- versus off-target ratios of GUIDE-seq reads relative to the 12 shared off-targets (see inset of (e)). (g-h) Indel analysis by targeted deep-sequencing of nine VEGFA2 off-targets (OT1-9) identified by GUIDE-seq and shared by wild-type SpCas9 (WT), SpCas9-HF1, eSpCas9(1.1) and evoCas9. Cells not expressing SpCas9 were sequenced to determine background indel levels. Two independent experiments were performed by mixing genomic DNA from three biological replicates before library preparation. For each off-target in (g), the solid circle corresponds to the mean of the editing percentage, while the shaded circles represent each experiment. (h) For each type of SpCas9, on- versus off-target ratios calculated from the mean editing levels measured by targeted deep-sequencing of the nine common VEGFA2 off-target sites. See Supplementary Fig. 8a for indel percentages.(i) Long-term specificity of evoCas9. Stable expression of wild-type SpCas9, evoCas9 and SpCas9-HF1 in 293blastEGFP cells transduced with lentiviral vectors. Each lentiviral vector also expressed the on-target sgRNA (sgGFPon) or a mismatched sgRNAs (sgGFP1314, sgGFP1819 or sgGFP18). EGFP knockout was evaluated by FACS analysis at the time points indicated in the graphs. Cells were kept under puromycin selection for the whole duration of the experiments. n=3 biologically independent samples except n=2 for WT and SpCas9-HF1 sg1819 (10 days) and evoCas9 sg1314 and sg1819 (all time points). Individual samples are reported as empty shaded symbols, while the overlaid solid symbol indicates the mean EGFP knockout level. In panels (f) and (h) statistical significance was assessed using the two-sided paired Wilcoxon signed-rank test, sample size n=12 in (f) and n=9 in (h). Summary of data distributions and statistical details are reported in Supplementary Table 5.

