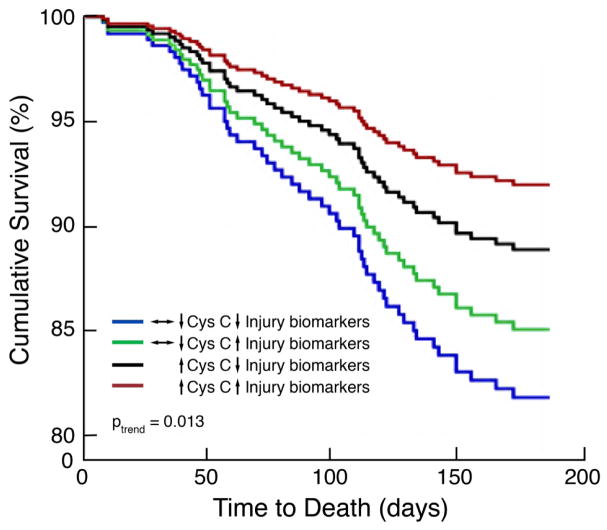
Figure 6. Associations between kidney tubular injury biomarkers and renal dysfunction with survival.
↑ Cys C indicates increase in cystatin C; ↔↓ Cys C, no change or decrease in cystatin C; ↑ Injury biomarkers, change in composite biomarker score >50th percentile; and ↓ Injury biomarkers, change in composite biomarker score <50th percentile. As shown, patients with a decline in kidney function and increase in tubular injury markers had the best outcomes and patients with no change or improvement in kidney function/tubular injury biomarkers had the worst outcomes; Ptrend indicates adjusted linear trend increasing from ↔↓ Cys C/↓ Injury biomarkers (high risk) to ↑ Cys C/↑ Injury biomarkers (low risk).

