
FIGURE 2.
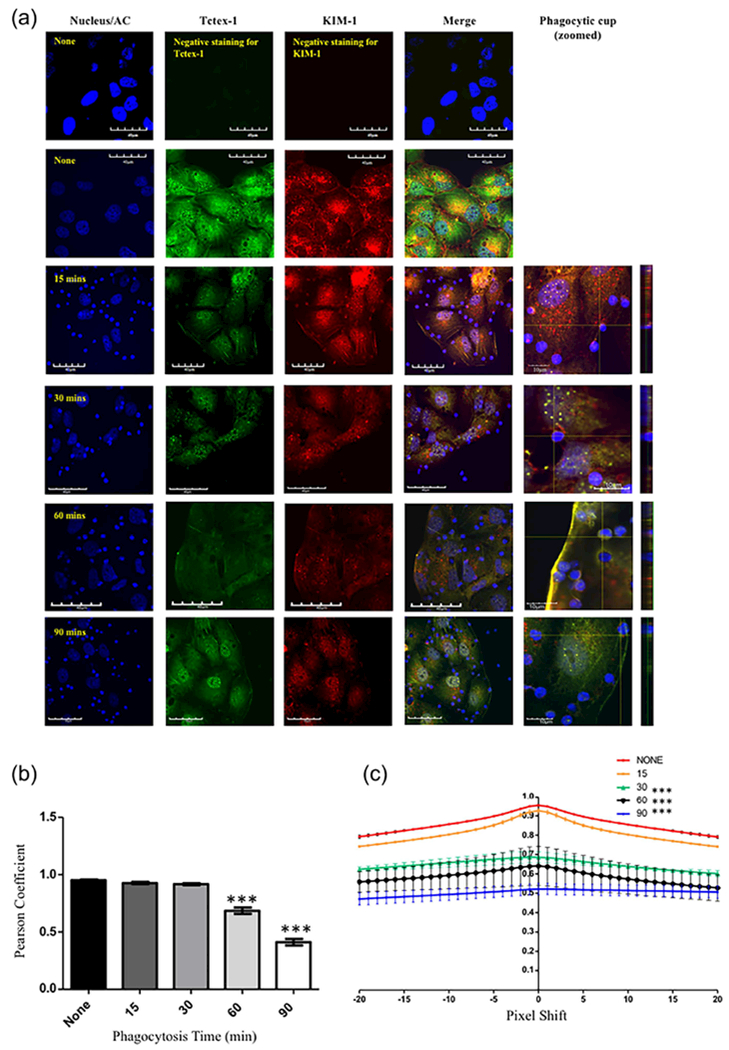
KIM-1 co-localizes with Tctex-1/DYNLT-1 during the early stages of phagocytosis. (a) 769-P cells were stimulated with apoptotic cells (blue) for various time points. Both KIM-1 and Tctex-1 were visualized using immunostaining for Tctex-1 (green) and KIM-1 (red) using Alexa-488 and Alex-555 labeled secondary antibodies as indicated in the experimental procedures section. Nuclei was counter-stained with DAPI (blue) (600×, bar represents 40 μm). Further magnification is shown for the phagocytic cup formed by KIM-1 and apoptotic cells (bar represents 10 μm). Vertical lines appearing at 90 min of apoptotic cells-stimulation are suggestive of Tctex-1 trafficking along microtubules as indicated previously (47). (b) Images of colocalization of both KIM-1 and Tctex-1 over the time course of phagocytosis were analyzed using Pearson’s coefficient (n = 3, ***p < 0.001, one-way ANOVA). (c) Colocalization of both KIM-1 and Tctex-1 during the course of uptake of apoptotic cells was analyzed using the Van Steensel’s approach, where the cross correlation function (CCF) was calculated with a pixel shift of ±20 (n = 3, ***p < 0.001 compared to none stimulated cells, one-way ANOVA). Quantification of colocalization score was assessed based on three random fields per sample and was done in three independent experiments