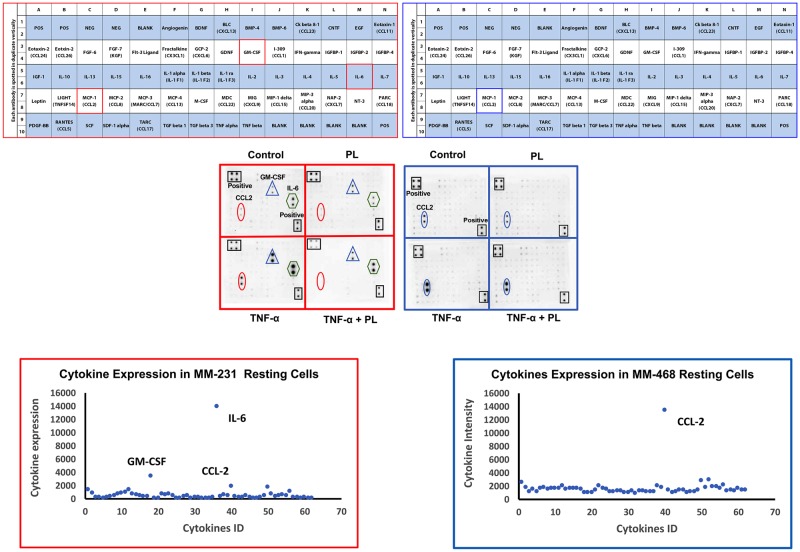
Fig 4. The effect of PL on different cytokine expression in TNF-α-activated MM-231 and MM-468 TNBC models.
Microarray map AAH-CYT-6 was used to assess chemokine/cytokine expression in the cell-free supernatants (A1 and B1). For each cell line, four blots represent the supernatants of the following cells: control, 4 μM PL (MM-231 cells) or 1 μM PL (MM-468 cells), TNF-α (50 ng/mL)-treated and, lastly, PL and TNF-α-treated. Microarray chemiluminescence detected the changes in cytokine expression in MM-231 and MM-468 cells (A2 and B2). Panels A3 and B3 represent highly expressed cytokines in resting cells. For MM-231 cells, the most-attenuated cytokines are CCL2, GM-CSF, and IL-6. However, CCL2 was the only impacted cytokine in MM-468 cells.

