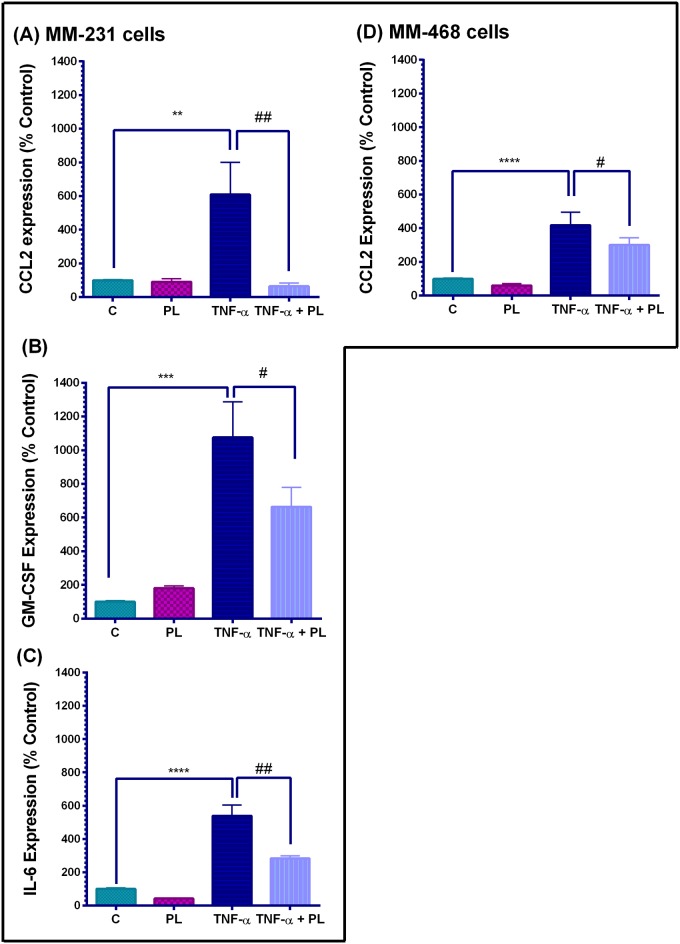
Fig 5. Cytokine array quantification in TNF-α-stimulated TNBC cell lines.
The effect of PL on the expression of CCL2, GM-CSF, and IL-6 in MM-231 cells (A-C), and CCL2 expression in MM-468 cells (D). The normalized data for each cell line show cytokine expression in four sets of experimental cell supernatants; control cells, PL-treated cells (4 or 1 μM PL, in MM-231 and MM-468 cells, respectively), TNF-α-stimulated cells (50 ng/mL), and co-treated cells (TNF-α +PL). The data points are expressed as the mean ± SEM of two independent studies, and the intensities are expressed as percent relative to control. The significant difference between the resting and TNF-α-activated cell groups (*), was determined by an unpaired t-test; the same for TNF-α stimulated vs. TNF-α+PL-treated cells (#). Significance is considered at **p < 0.01, ***p < 0.001, ****p < 0.0001, #p < 0.05 and ##p < 0.01.

