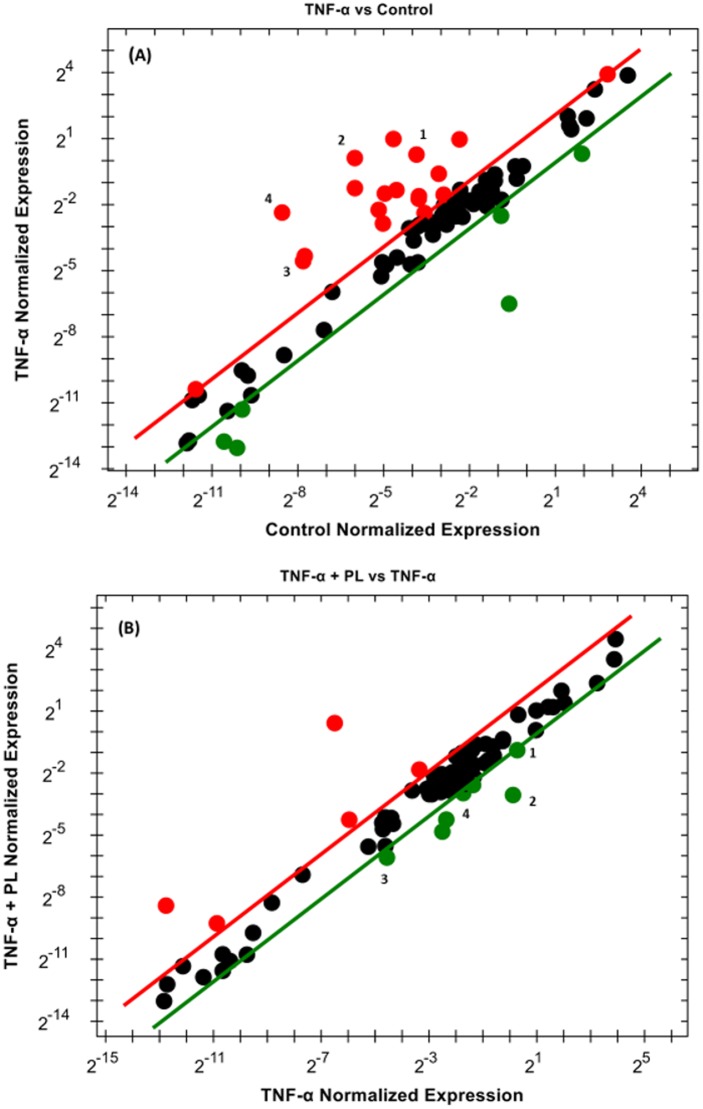
Fig 8. Scatter plot for MM-468 cells.
Normalized mRNA expression of target genes for the control vs. TNF-α stimulated cells (A) and TNF-α vs. TNF-α + PL (B). The plot image shows the following changes in target gene expression based on the threshold set: upregulation, red dots, downregulation, green dots, and no change, black dots. The most-downregulated genes are enumerated from 1–4 as follows: BIRC3, CCL2, TLR2, and TNF.

