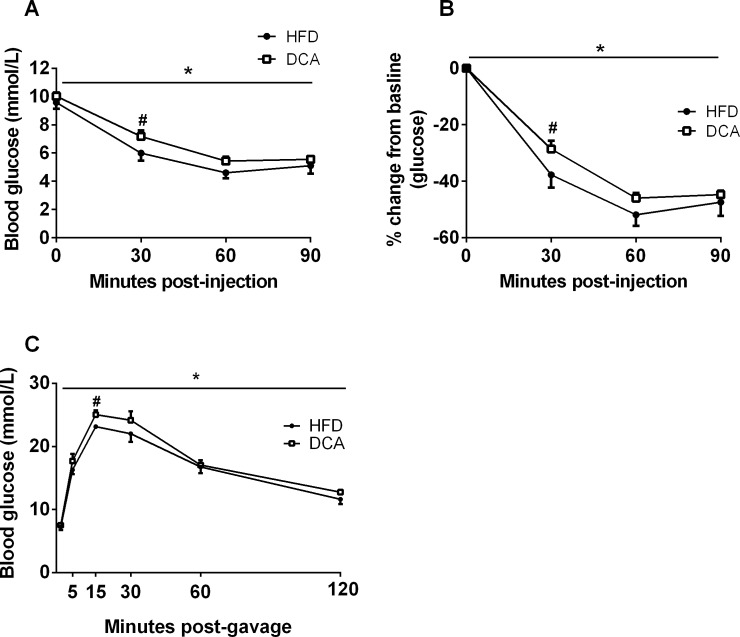
Fig 4. DCA supplementation impairs glucose homeostasis.
Absolute blood glucose concentrations (A) and percentage change from baseline blood glucose concentrations (B) during an insulin tolerance test. (C) Blood glucose concentrations during an oral glucose tolerance test. Data are expressed as mean ± SEM, *P<0.05 by two-factor ANOVA, #P<0.05 by Student’s t-test, n = 8 per group.

