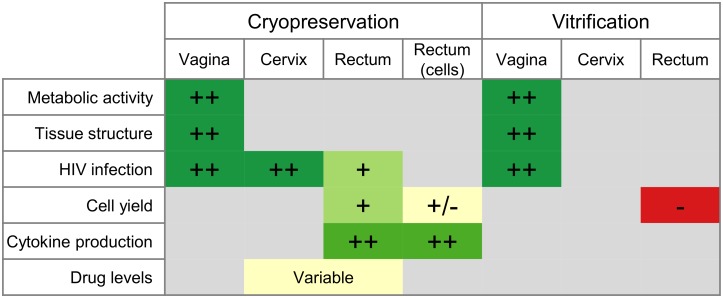
Fig 8. Summary of all cryopreservation and vitrification experiments and tissue types.
Signs indicate performance of each tissue type in each assay, relative to the performance of the fresh tissue. ++ indicates equivalence to fresh, + indicates a reduction but probably acceptable, +/- indicates marginal performance, and—indicates inadequate. Colors also indicate performance, with red to yellow to green representing worse to better performance, as compared to fresh tissue. Gray squares indicate that the assay was not performed for that combination of sample type and preservation type.

