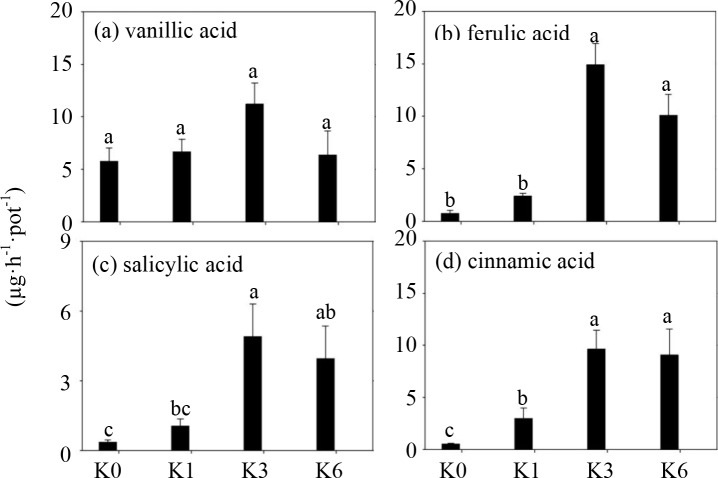
Fig 4. The exudation rate of four phenolic acids from soybean roots under treatments of different K concentrations in the sandy culture at the flowering stage.
K0, No K application; K1, 1 mM K; K3, 3 mM K; K6, 6 mM K; Each histogram represents the mean of four replicates ± SE. Different letters above the bars indicate significant differences (P<0.05) by Duncan’s t-tests.

