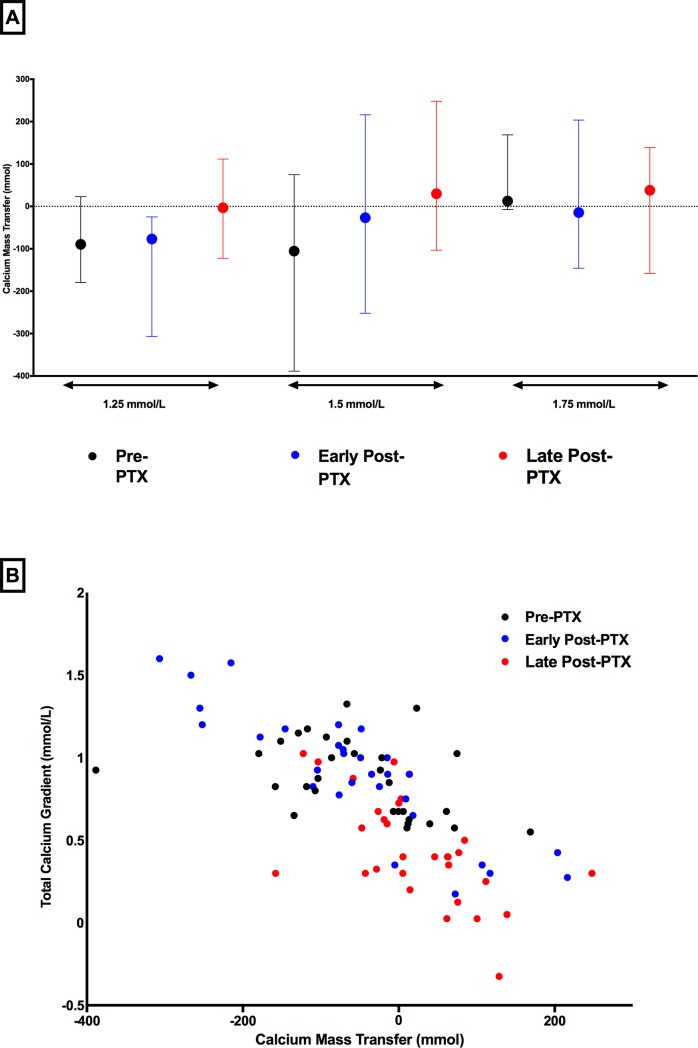
Fig 2.
Plot of Ca mass transfer according to d[Ca] 1.25, 1.5 and 1.75 mmol/L in each phase of the study: Pre PTX (black), Early post-PTX (blue) and Late post-PTX (red). Markers and lines represent median and minimal and maximum values of Ca mass transfer (A). Relationship between Ca gradient (using total Ca) and Ca mass transfer in each phase of the study. Markers represent results from Pre PTX (black), Early post-PTX (blue) and Late post-PTX phases (red) (B).

