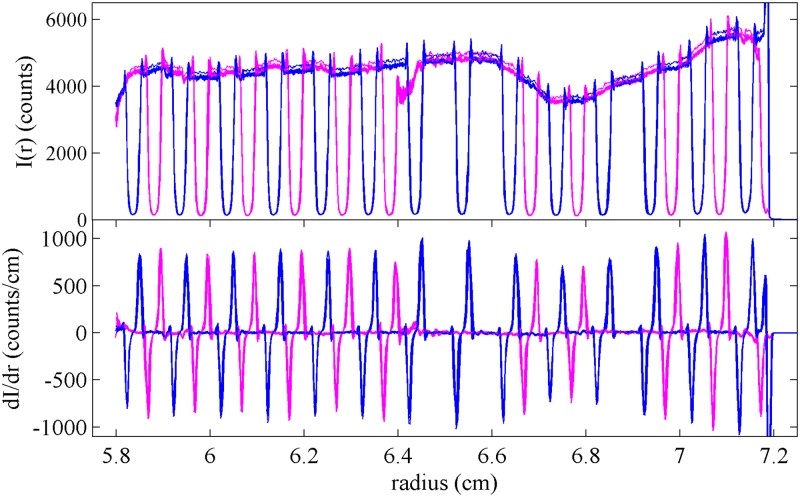
Fig 3. Radial scans of transmitted intensities.
Superposition of 10 intensity scans of the artifact using the absorbance optics at 280 nm in stepping mode with radial resolution of 0.001 cm, showing the signal of the sample side (blue) and reference side (magenta). The top panel shows the raw data, and the bottom panel shows a derivative plot (calculated with Savitzky-Golay filter [29] with frame length of 7 and polynomial order of 2). The intensity of the transmitted light varies slightly and with low spatial frequency due to variations of the local photocathode sensitivity.

